
By: Noah Thurm
It's September 14th, and I still can't get this Mike Trout at-bat against Kenley Jansen from a month ago out of my head:
Sure they were borderline, but how does the best player on the planet take 3 strikes without even so much as starting his swing? I'm not in the business of disagreeing with Trout on anything when it comes to hitting, but his startling passivity here got me thinking about the broader strategy at play, and what swing behavior on those borderline pitches might tell us. The ability to distinguish between pitches just in and just out of the zone surely is important to a hitter's success, and I wanted to better understand who does it well and the specific implications of this more specific plate discipline. I found that controlling the edges first lets a hitter dominate the middle and command an AB, which are incredibly powerful skills to have. First though, I needed to start sorting pitches by location. To come up with a classification system, I used Statcast's zones as a point of departure:
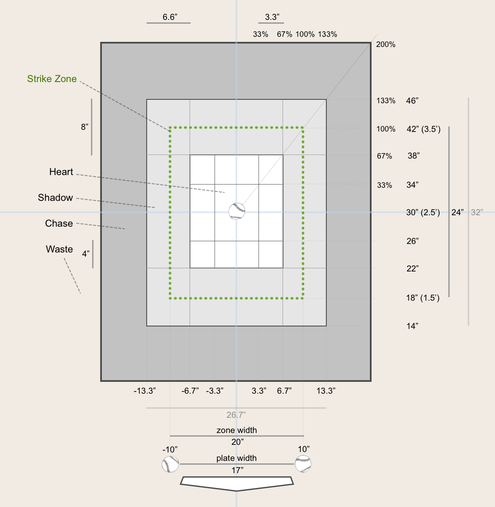
To answer my question, though, I had to split Statcast's "Shadow" into two different zones, "Edge", the portion in the strike zone, and "EdgeOff," the portion outside of the zone. In trying to find significance in swing behavior around the edges, I first thought that the difference between a player's "Edge" swing rate and "EdgeOff" swing rate, or "Edge Differential", as I called it, would show some meaningful relationships with production. It seemed logical: the guys with the biggest differentials are the most in tune with where exactly the strike zone starts and stops, and that ought to translate to their performance. This produced some really noisy data, however, and no strong trends emerged, so I went back to the raw swing rates, this time looking at walk rate. With some basic regression analysis, I found that "EdgeOff" swing rate outperformed chase rates, whiff rates, zone swing, and O-swing in predicting a player's walk rate, per a relative importance test:
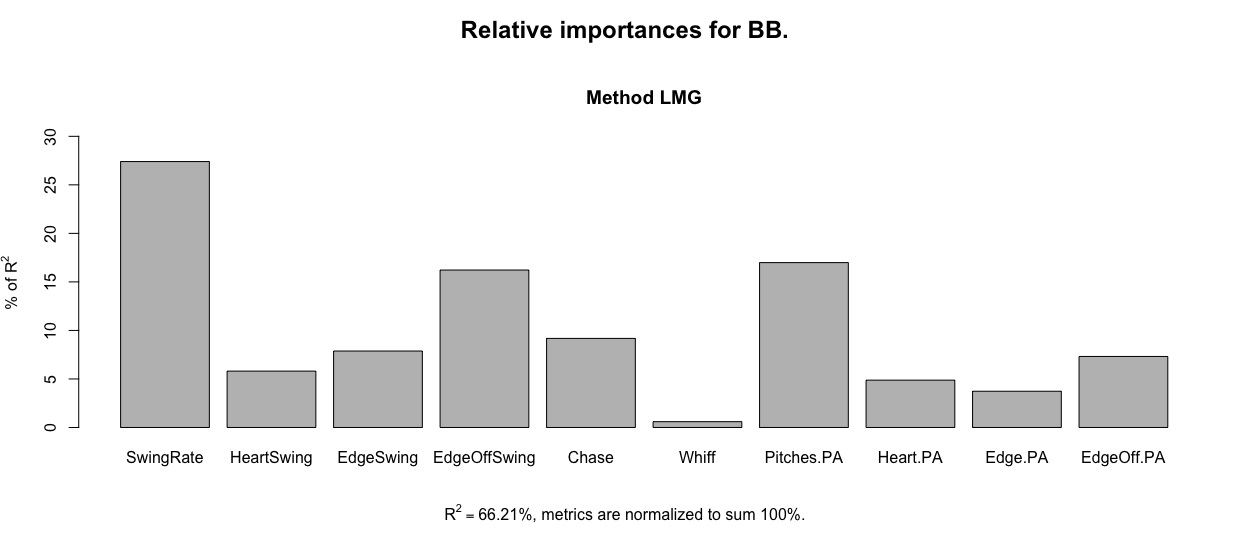
That was interesting, but hardly revolutionary. Players who swing at fewer balls walk more -- fascinating -- it just so happened that the type of ball I was looking at was seemingly most important. It wasn't until I started thinking about the intra-AB consequences of that patience that some more meaningful relationships began to emerge. Not only do players with better discipline walk more, they see more pitches per plate appearance (denoted by "Pitches.PA" in the model). And the longer an at-bat goes on, the more likely a pitcher is to make a mistake. Looking at the percentage of pitches in the heart of the plate by pitch of at bat shows us the benefits of battling:
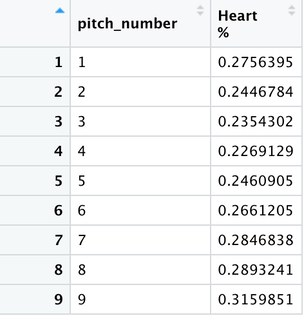
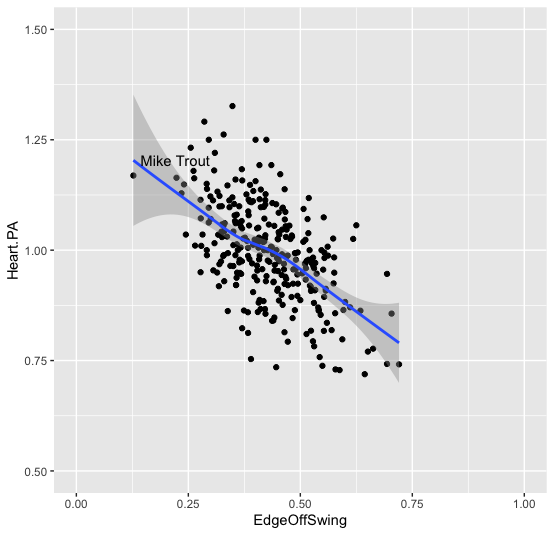
Pitchers try to get ahead early and attack the zone, but in longer at bats by the 5th pitch there is a consistent upward trend in pitches over the heart of the plate. What's surprising is that the correlation between "EdgeOff" swing rate and Heart pitches per PA is the exact opposite of the correlation between pitches per PA and Heart pitches per PA (r = -0.6 and r = 0.6). Showing this graphically begins to explain Trout's approach and why he may have spat on all three Jansen fastballs:
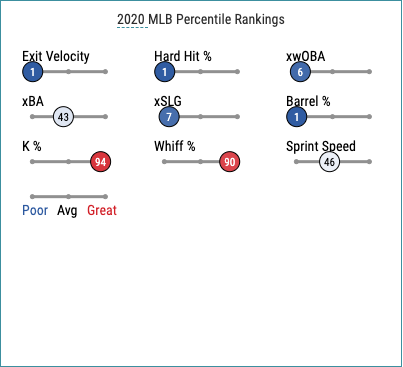
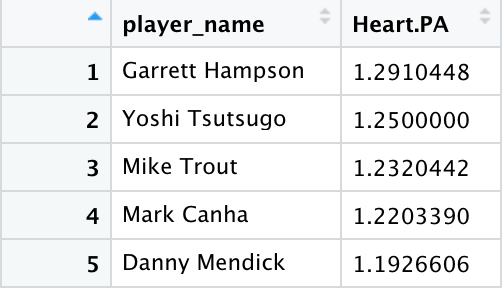
Why is the most dangerous hitter in the game seeing the third most meatballs of players with at least 100 PAs this year? Trout's vision and discipline are elite, and pitchers are forced to come over the plate to him because he just won't expand the zone. Once a pitcher does come in, though, Trout swings, and as we know, doesn't often miss. His swing density plot is a testament to this extreme discipline and self awareness:
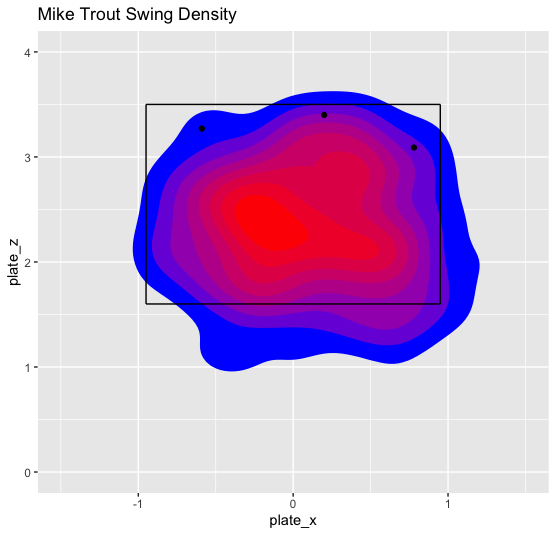
The one place he will expand the zone is down, which he historically crushes. The three pitches from Jansen were all up and classified as "Edge" pitches, dodging the hot zones of Trout's swing behavior. Rather than expand his zone and put suboptimal swings on three well-executed pitches, it seems like Trout was willing to take the strikes, banking on a mistake later on. This strategy didn't work in that at-bat and the Angels lost the game, but Trout's selectivity clearly pays dividends over the course of a season. By contrast, the player with the highest "EdgeOff" swing rate this year, Hanser Alberto, has put on a less-than-stellar showing for the Orioles.
He also sees the fewest Heart pitches per plate appearance on average, and those marginal differences certainly matter as at-bats, games, and seasons wear on. Obviously, players hit Heart pitches better than others, but just how much so is a little striking:
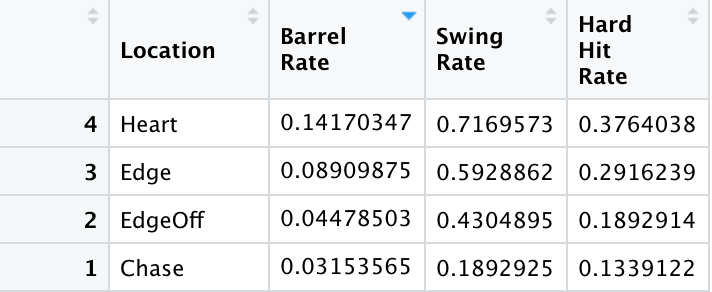
The Major League average for Barrels per Batted Ball Event (Barrel Rate) this year is 9.49%, meaning players are faring roughly 50% better on Heart pitches. Pitches on the Edge are still in the zone, but hitters barrel them up only 2/3 as often. Most importantly, "EdgeOff" pitches can be separated by Edge pitches by mere fractions of an inch, but players are producing just half as well on those pitches. Making the distinction between just in and just out can amount to a whole-meatball difference per game, and put players in a position where average looks like this:

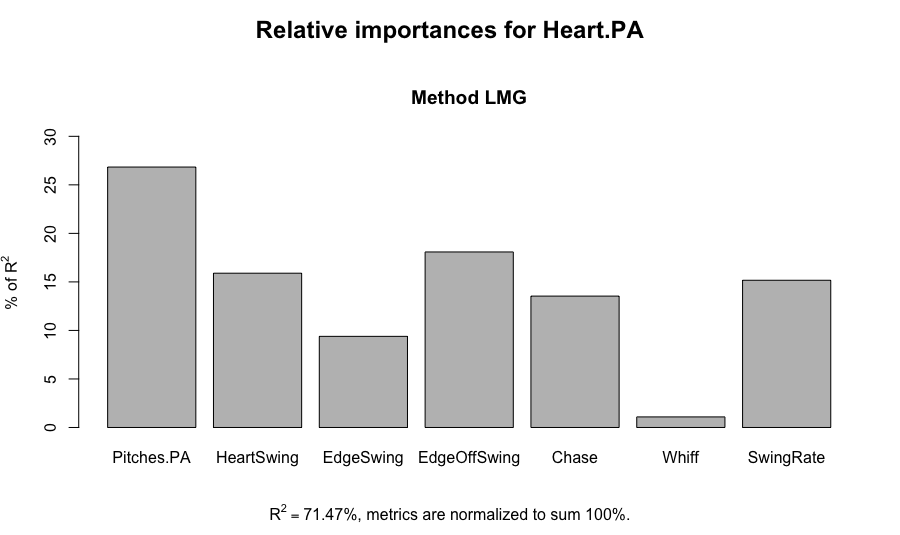
As far as seeing more pitches over the heart, having a low "EdgeOff" swing rate is more important than even Chase and Whiff rates. Eliminating a pitcher's ability to nibble around the zone is a hugely beneficial but difficult to develop skill, but its significance is undeniable in predicting pitches over the Heart per PA:
We know successful hitters control the zone and don't chase bad pitches, but there's clearly more to understanding discipline than just ball and strike. Edge pitches are still tough to hit, and if a pitcher knows he can still get a swing on a mis-executed Edge pitch that ends up out of the zone, he has no reason to tangle with the middle of the plate. Being able to consistently differentiate between those borderline pitches puts the hitter in the driver's seat and increases the chance of seeing a mistake. That's not to say that this analysis is without limitations, however. It may be that worse hitters are challenged more and just have fewer opportunities to overswing; Trout isn't exactly among league-leading thumpers in the Heart per PA rankings. In fact, we find no strong correlation between swing behavior around the edges and statistics like SLG or WOBA. What is convincing, though, is the need to look at discipline with a sharper eye than just O-Swing and Zone Swing to begin understanding the benefits of sitting on a particular spot vs. attacking all strikes. Other metrics like Strike Probability are emerging as ways to better quantify discipline, and I'm interested to see how the research develops, particularly around the edges of the zone. Hitters want mistakes to punish, and in the interest of seeing more they may be better off tipping the cap and taking a well-placed strike than trying to barrel a tough pitch. Not all pitches you can hit are pitches you should hit, and understanding that could lead to more swings to damage with, and ultimately more success.
0 Comments
Over the past year, our analytics team has had an incredible experience working alongside the coaching staff to help leverage data analytics for player development and strategy. Through this process, we have been exposed to the inside of a collegiate baseball program and have an appreciation for all the decision making involved both on and off the field. Our team has tackled a variety of projects from utilizing Trackman data to create reports for players before games to working on an effective way to track progress on workouts to creating an algorithm for a pitch grader. All of these experiences have taught us valuable skills regarding the integration of analytics and baseball and pushed us to think in an innovative way.
We wanted to take this time to thank Coach Niesen for granting us all this opportunity to be involved in the program as we’re all so grateful for the experience. None of this would have been possible without his guidance, and our whole team truly appreciates his mentorship as Coach Niesen’s insight has taught us all so much. He brought us into the fold and trusted us as valuable contributors to the team’s success. We wish you all the best going forward! With that being said, we are also extremely excited for the future of the program and hope to continue assisting the team as we believe Georgetown baseball is on the road to continued success and growth. Congratulations to Coach Thompson on being named head coach - his track record and experience is incredibly impressive, and we are looking forward to the road ahead! We know that with the analytical foundation we’ve built and the momentum the program has now it is only a matter of time before Georgetown is competing on the national stage year in and year out. Hoya Saxa, Georgetown Baseball Analytics By: Noah Thurm If you’ve got it, you might as well throw it. Even as league-wide velocity has trended upwards (up to an average of 93.4 MPH in 2019), pitchers are increasingly turning to their offspeed pitches to get outs. The heavy reliance on breaking pitches bucks the traditional idea of “saving” your best pitch for strikeouts or dangerous situations, and league-wide data seems to support this shift in approach. To flesh this out, I compared year-to-year changes in usage rate with the corresponding year-to-year change in whiff rate for every Slider thrown since 2015. Somewhat surprisingly, there is no convincing evidence of a reduction in effectiveness when use increases. 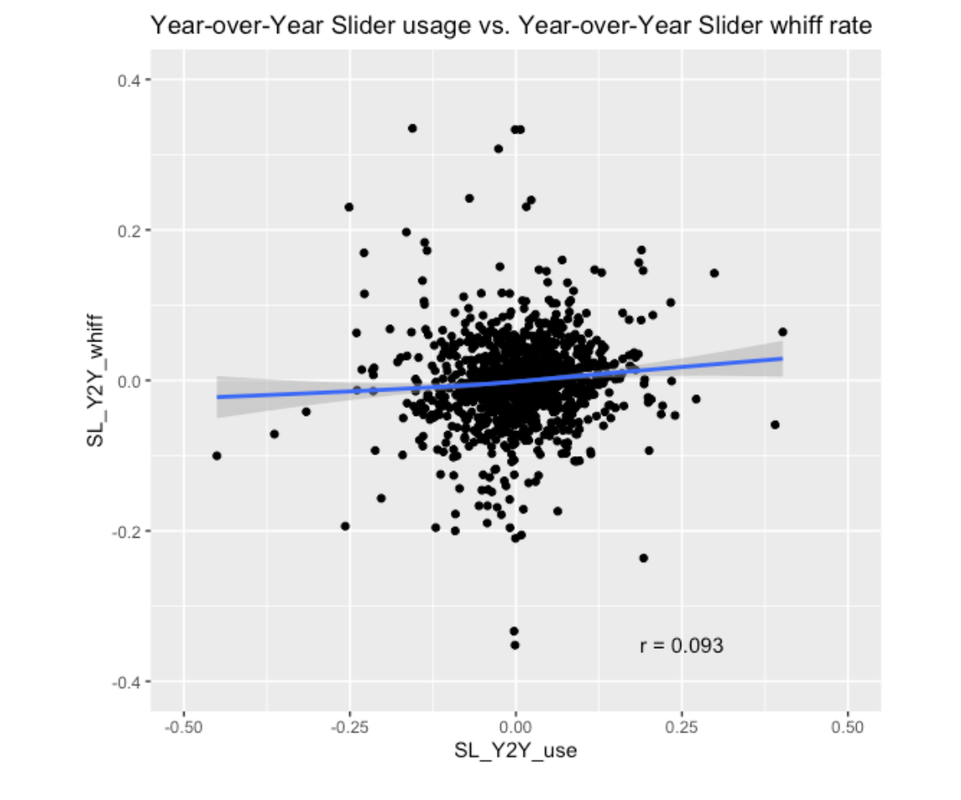 Naturally, most players are clustered around changes of 0, but across the board guys who make big jumps in Slider usage see no consistent downward trend in whiffs as we might expect. Even isolating the extremes returns much the same result: 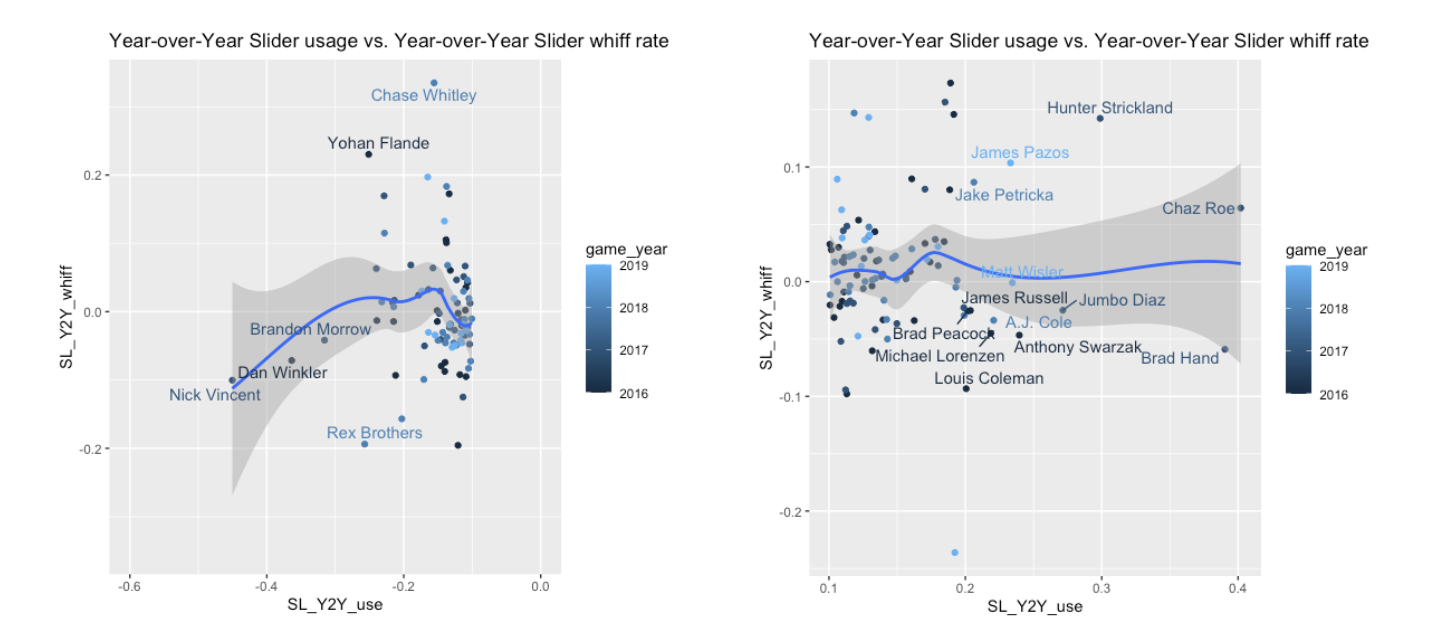 Obviously there are outliers, but it stands to reason that a high-performing pitch thrown in limited quantities will not lose its effectiveness even with a fairly large jump in usage rate. That said, what makes a good candidate for a high-use pitch, and what pitch shape is most conducive to success? To try and answer that question, I wanted to nail down which pitch characteristics contribute to the variability in year-to-year change, even though there’s no stark trend overall. Looking at the graph on the right, I wanted to know why, for example, Hunter Strickland found success and Jumbo Diaz didn’t. I conducted a Variable Importance test to try and rank average pitch characteristics by their impact on year-to-year changes in whiff rates and determine whether a particular style of Slider can best accommodate a jump in use. 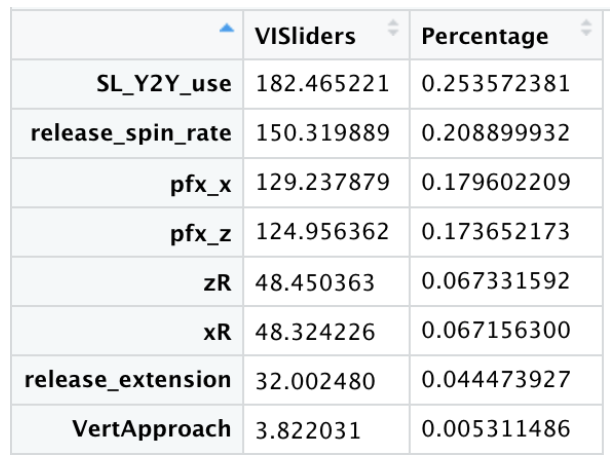 This lines up with our anecdote, as Hunter Strickland has averaged nearly 400 more RPM than Diaz on his Sliders across their careers. In the case of Sliders, there certainly seems to be more than one way to skin the proverbial cat, and no one spin or movement profile that performs best on its own. The most impactful pitch characteristic was Spin Rate, which makes intuitive sense. More spin generally means more movement, but for Sliders spin is necessary for both tight and looping pitches. To even attempt to identify a potentially devastating Slider, we first need to understand the mechanics of the pitch and how they’re thrown across the league. Traditionally, Sliders are thrown with a lot of gyro (think: football) spin that does NOT contribute to movement (the remaining, or “active”, spin is a combination of back- and sidespin). This produces a very low spin efficiency, which is just the percentage of total spin that is “active”. Low-efficiency/high-gyro Sliders create the appearance of “depth” and a pitch that doesn’t seem to move a whole lot (0-5 inches of horizontal break) but misses barrels with “late” break.  (From @PitchingNinja, ~12% Spin Efficiency) The higher spin efficiency climbs, and the more total spin contributes to movement, the more horizontal break or “sweep” a Slider will get. The relationship between spin efficiency and horizontal movement is very strong league-wide: 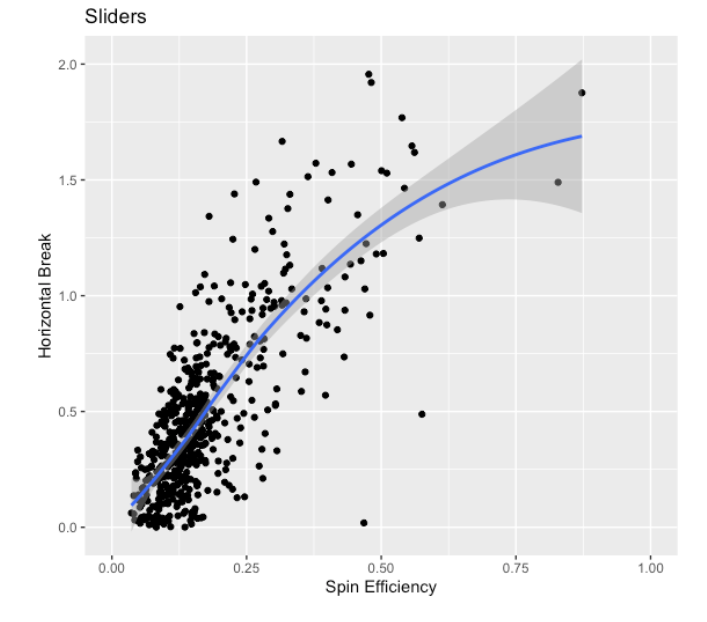 Back to our initial question, is there a “type” of Slider that performs better with higher use? There is no particular trend to usage rate along the efficiency/break curve, which led me to a potentially important realization: the success of high-use breaking pitches might be as influenced by the rest of a pitcher’s arsenal as much as the characteristics of the pitch itself, even when hitters don’t see them much. I’ve found that elite sliders are matched by pitches with nearly “opposite” spin and movement profiles, combining for a deadly arsenal. To illustrate this, I took a “Goldilocks” approach to our Slider curve, and picked a player at each extreme, and one right in the middle: 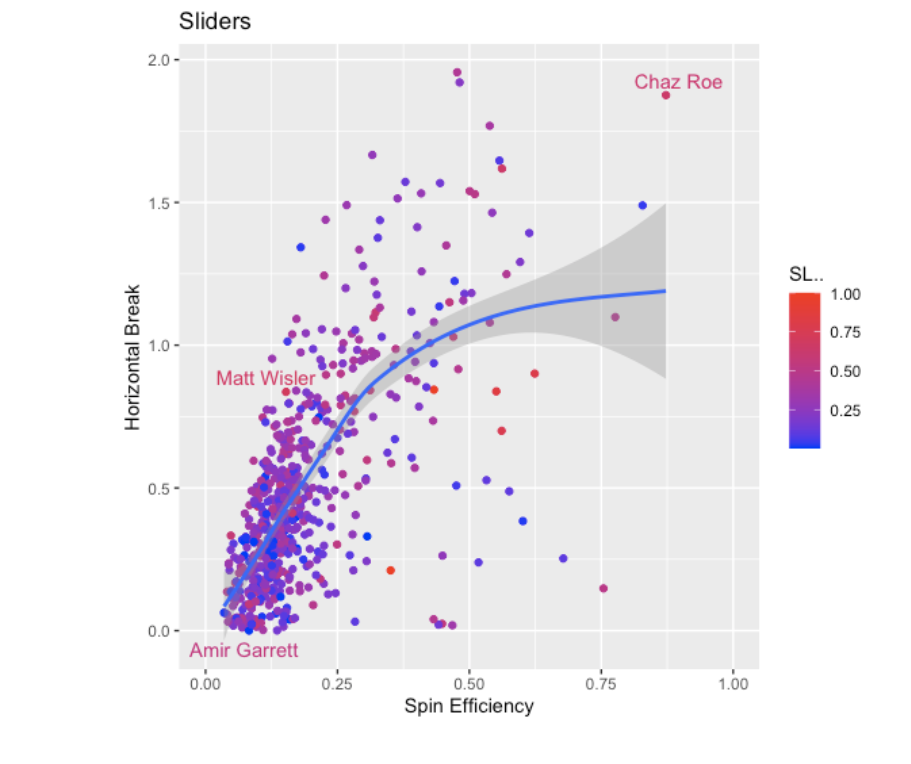 Three players, three vastly different Sliders, all thrown well over 50% of the time. So why does each work? I’ll start with PitchingNinja starlet Chaz Roe, owner of the most gif-able Slider in the league and an average horizontal break of 22.4 inches(!!). Roe’s Slider has more sweep than a broom closet, thanks to an insane career average spin efficiency of about 89% (up to 95% before his injury this year). For context, the average MLB Slider in the statcast era has a spin efficiency of about 20.6%, so it’s no surprise Roe is generating league-dominating movement. Through 159 pitches and 93 Sliders this year Roe had yet to surrender a barrel, allowing a WOBA of just .243. Roe’s Slider has almost no vertical movement, which is easy to imagine given his release:
That isn’t the only pitch of Roe’s you’ll see on your Twitter timeline, as the Sinker he throws roughly 21% of the time looks equally stupefying:  The reason I think Roe (and Wisler and Garrett) are so effective is because they generate a high degree of “spread” in their arsenals by throwing pitches with divergent spin and movement. (For an in-depth discussion of the idea of arsenal “spread” and its implications for pitch design, check out my earlier article.) Looking at each of Roe’s pitches mapped by Horizontal and Vertical Break makes this really easy to understand: 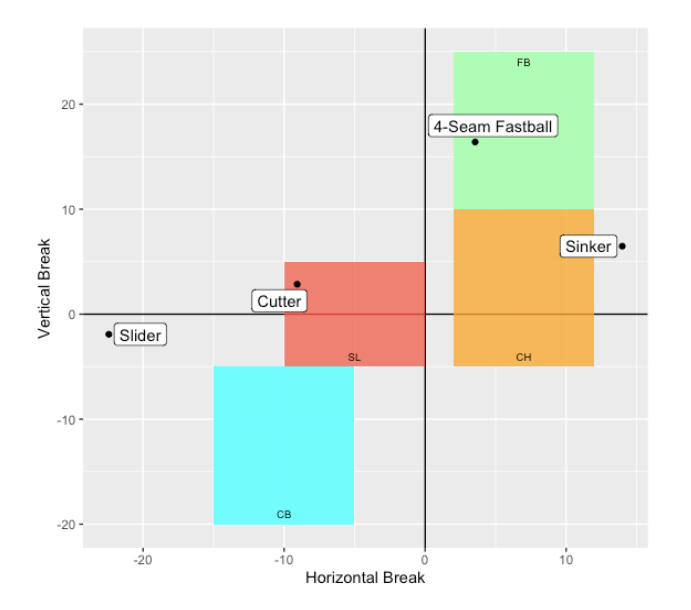 Roe’s insane sweeping Slider is really well matched by a 70% efficient Sinker with tons of armside run, keeping pretty much all of his offerings on a nearly-identical horizontal plane. This allows Roe to disguise the movement on his Slider because it looks enough like the Sinker right out of hand. That’s how he generates such ridiculous swings on a pitch the entire stadium knows is coming.  Garrett, on the other hand, throws a much tighter Slider with a spin efficiency of roughly 16%. He generates just 0.4 inches of Horizontal Break on average, but is posting an insane .180 WOBA and 66% whiff rate so far this year. While on the surface it seems to be a less impressive pitch than Roe’s it fits into Garrett’s arsenal and plays off his other pitches equally well. Rather than the horizontal-heavy approach we saw with Roe, Garrett relies on a 95 MPH 4-Seam Fastball as his secondary pitch, controlling the vertical plane with a high-spin Fastball with almost 10 inches of “ride” above his Slider. 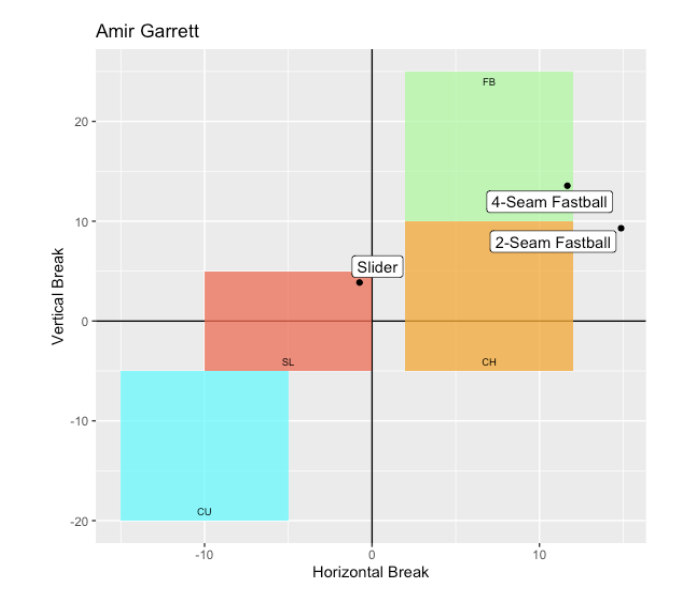 Unlike Roe, Garrett’s pitches depart on the vertical axis out of release, making for an equally devastating combination: Amir Garrett Slider 08-23-2019 GIF Amir Garrett Fastball Along with the low efficiency, Garrett doesn’t generate much spin at all on his Slider, seemingly running counter to the results of our earlier variable importance test. To me, this reinforces the need to keep pitches in context with the broader arsenal, even when a pitcher doesn’t make much use of it. That leaves us with Wisler, our Goldilocks, who is throwing his Slider a whopping 80% of the time this year yet maintaining a 38% whiff rate. Wisler falls between Garrett and Roe by Spin Efficiency at 58% this year and around 25% average for his career. Similarly, he splits the gap in movement, with an average Horizontal Break of 11.5 inches, almost exactly splitting Roe’s 22.4 and Garrett’s 0.4 inches of movement.  Wisler has the least of an “arsenal” to speak of, but plotting it on the same map gives us much the same result: 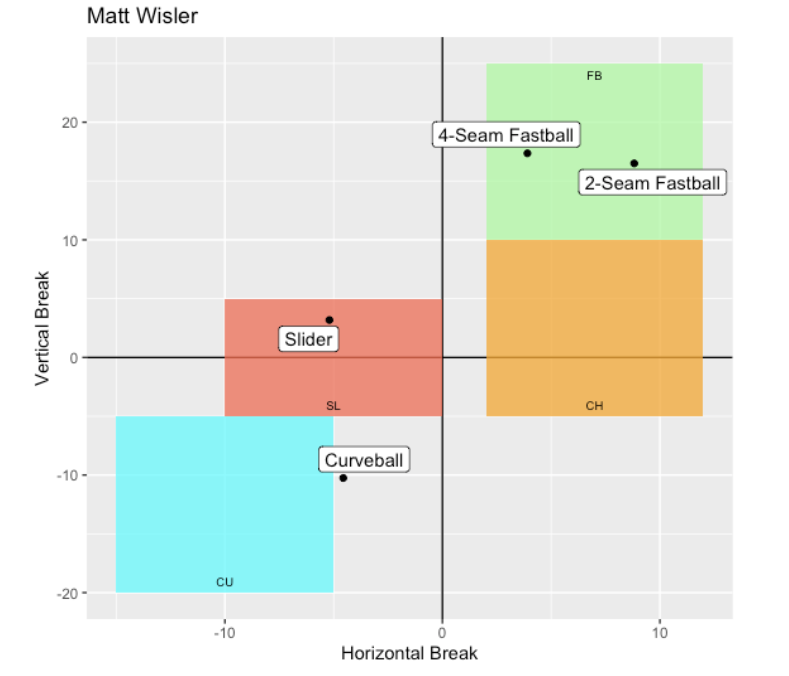 Like Garrett and Roe, Wisler maintains “spread” across his pitches and matches the moderate movement on his Slider with similarly moderate (and opposite) movement on his 4-Seam Fastball, which he throws the other 20% of the time.
Ultimately, there is no one way to throw a Slider, and no single recipe for how to make it effective at high usage rates. That said, I don’t think it’s insignificant that Wisler’s “Goldilocks” slider is having similar success at the highest usage rate, potentially signalling a reduction in dependence on the rest of your arsenal. If each guy had to throw their Slider 100% of the time, I might put my money on Wisler’s despite its subjectively less impressive movement and spin characteristics. An important takeaway in my mind is the necessity of balance in a pitcher’s arsenal, and the more extreme a pitch becomes, the more important it is to balance its movement with an “opposite” pitch to stay deceptive and effective. I think Roe’s demonic Slider becomes easier to take if it’s thrown every time, and Garrett’s tighter Slider plays up off of his heater. I’m left then with a similar conclusion I had initially -- the success of a high-use breaking pitch is as dependent on the quality of the rest of the arsenal as it is on the pitch itself -- and even the most impressive pitches need the threat of another offering to keep hitters on their toes and generate whiff after whiff, year after year. By: Noah Thurm Most successful major leaguers drive the ball in the air consistently with a slight upward swing, but at the extremes this approach may bring sacrifices. Players are often discouraged from a fly-ball oriented approach in the name of contact and whiff rates, but I think plate coverage is most strongly hurt by a steeper swing. I’m most interested in how much of the zone a player can effectively control, not just throw the bathead to, so in this article I’ll use the 2D area captured by all of a player’s barreled balls as they reach the plate, or “Barrel Area,” to break this down. The next step is estimating each player’s Attack Angle, or the angle of the bat path relative to the ground through the zone (large positive values indicate steep upward swings, negative values indicate the bat impacts the ball on the way down). Attack Angle isn’t directly measured by pitch-tracking technology, but with a little intuition and some physics we can get pretty close. The bat-ball collision brings us three angles of interest, the (usually) downward angle of the pitch (Vertical Approach Angle), the (usually) upward angle of the bat (Attack Angle), and the resulting angle of the batted ball (Launch Angle) (The centerline angle will contribute to batted ball spin, but isn’t of immediate importance here). 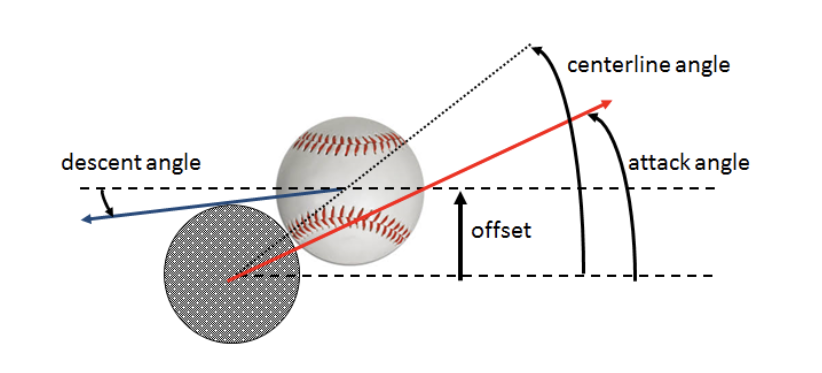 Balls that are hit the most “square” or “flush” leave the bat with launch angles closely matching the attack angle of the swing, limiting launch angle “deflection”, as I refer to it (for a more in-depth explanation and implications for pitching strategy, check out my last article). This forms the basis for our estimation of attack angle, because we can be fairly confident that a player's hardest hit balls leave the bat at about their swing’s attack angle. To come up with the final estimation, I took the peak of the launch angle distribution (i.e. the most common launch angle) for the top 20% of each Major Leaguer’s batted balls by exit velocity. As a check, we can compare the estimations of attack angle to average launch angle and see that they track together quite well, with more barrels at higher angles as we’d expect:  Charting those calculated attack angles against Barrel Area seems to answer the initial question pretty convincingly: 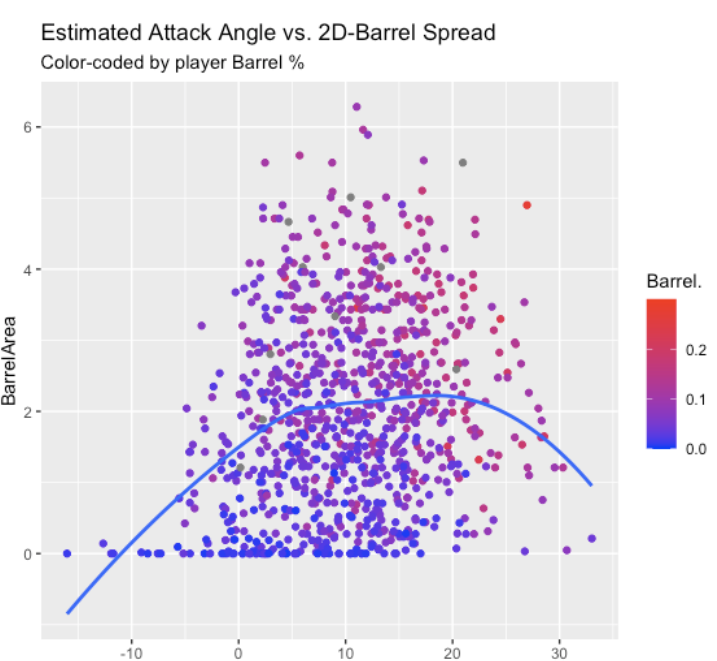 A 13° attack angle maximizes the area covered on the regression line, with attack angle extremes at each end fairly quickly compromising plate coverage. Given that most pitches enter the zone at downward angles between ~3° and ~12°, that swing path “matches plane,” giving the hitter the greatest opportunity to get the barrel to the ball. Unsurprisingly, Barrel Area is fairly strongly correlated with a player’s barrel rate (r = 0.55) and xwOBA (r = 0.52), seen below. 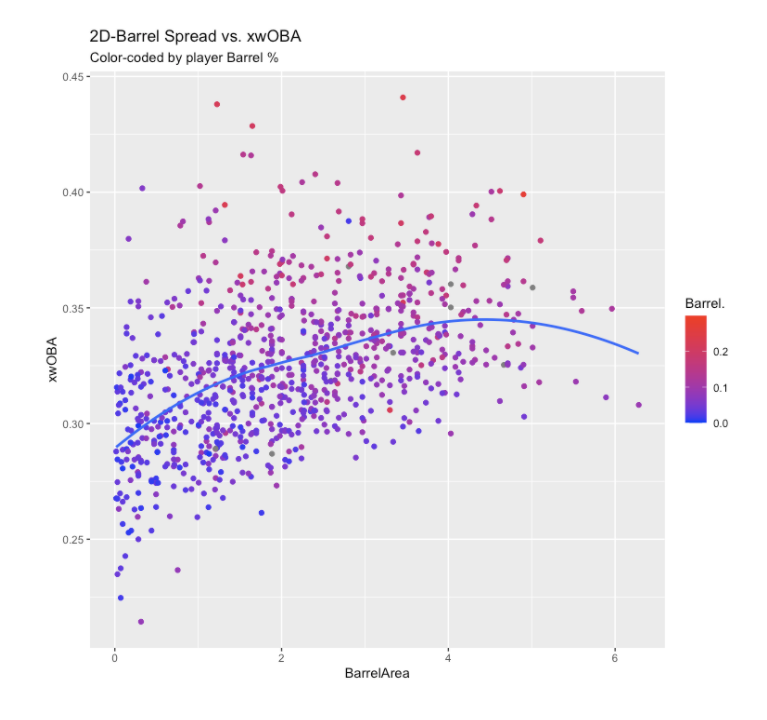 Estimating attack angle can also give us a glimpse into a player’s barrel control and barrel accuracy, as highly accurate players will minimize their average launch angle deflection, preventing mis-hits. Like barrel area, we see that an attack angle in the low teens seems to produce the most barrel accuracy: 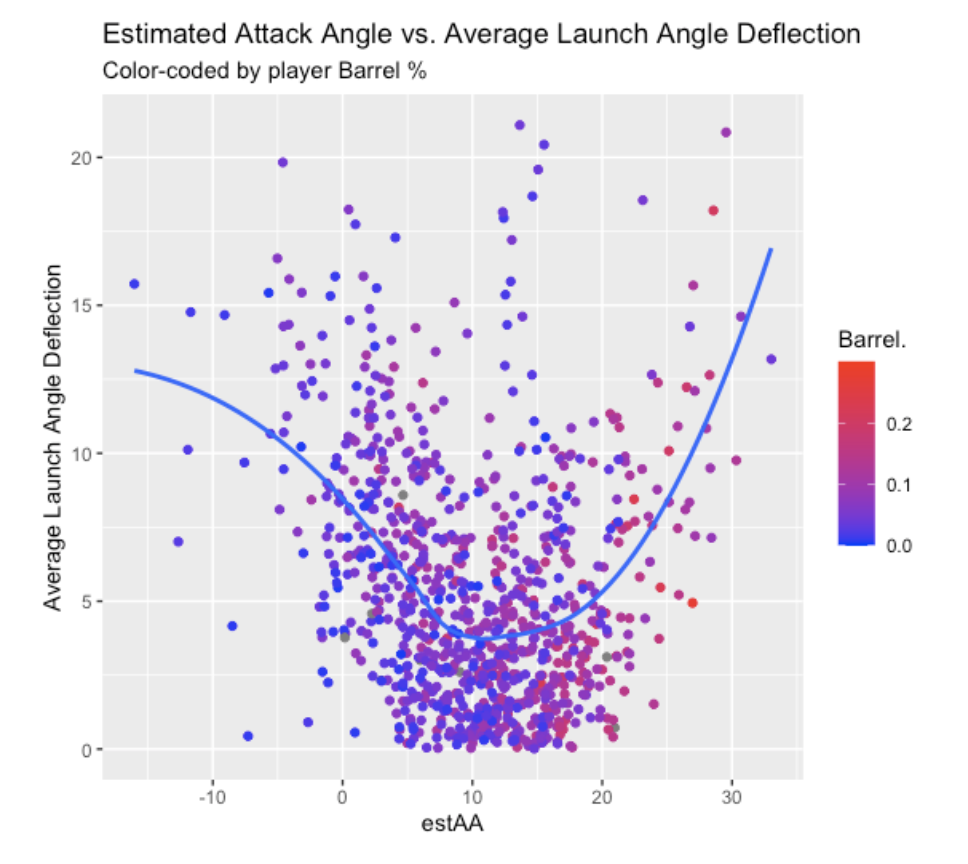 That being said, I’d caution the use of average launch angle deflection as a measure of swing control and discipline because it fails to accurately represent players who avoid mishits by just not hitting the ball at all in unpreferred locations. High whiff rates are disguised by the appearance of consistency in launch angle where a player tends to miss balls outside of their Barrel Area. To recap so far, we can be fairly confident that:
So is plate coverage a production panacea, and should hitters accordingly seek to maximize it by swinging with an attack angle in the low teens? As is so often the case, the answer isn’t quite that simple, and we can see it by looking at two seemingly opposite players, C.J. Cron and Freddy Galvis. 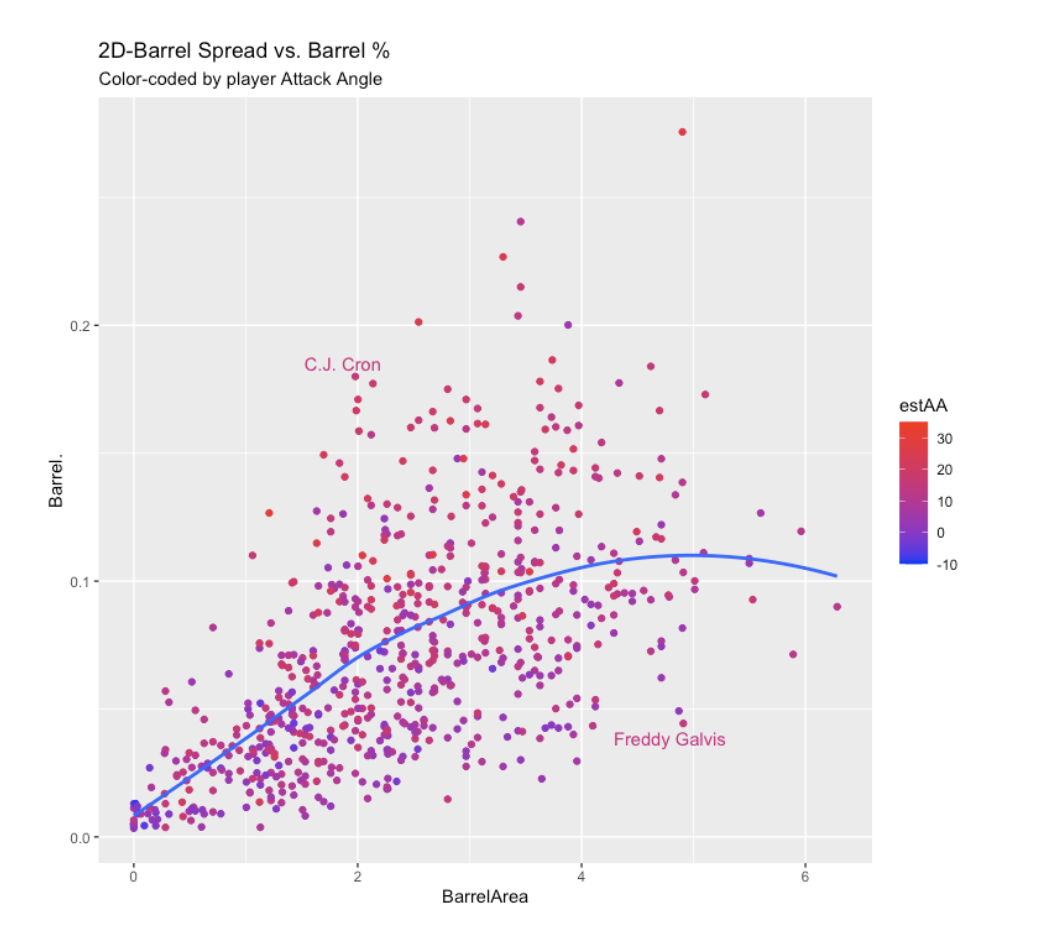 Given what we’ve just established, aren’t these guys getting it all wrong? Galvis is covering the plate but not producing (4.43% Barrel rate), and Cron dominates a much smaller wheelhouse (18.5% Barrel rate). With that coverage disparity, you’d expect Cron to have a much steeper attack: 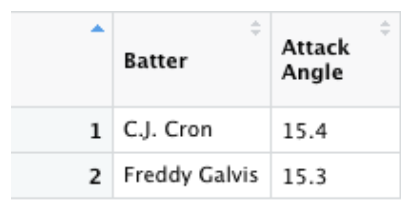 Well, Cron is a power hitter, so probably produces more barrels by hitting the ball harder: 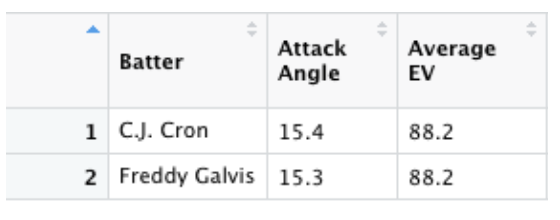 Huh. If a Barrel is driven in the air, Cron definitely hits fly balls more frequently, right? 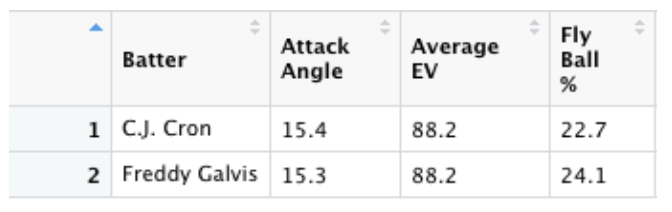 Cron and Galvis swing nearly identically, hit the ball with equal authority on average, and drive the ball in the air at roughly the same rate. So what gives? To answer, we need to go back to one of the first pieces of intuition laid out: a player's hardest hit balls leave the bat at about their swing’s attack angle The flip side of this is that any ball not hit at around the attack angle loses some exit velocity on account of that “deflection” and the reduction in contact quality. Taking a random sample of 5% of the batted balls in the Statcast era (~30,000 events) makes this point quite clearly. 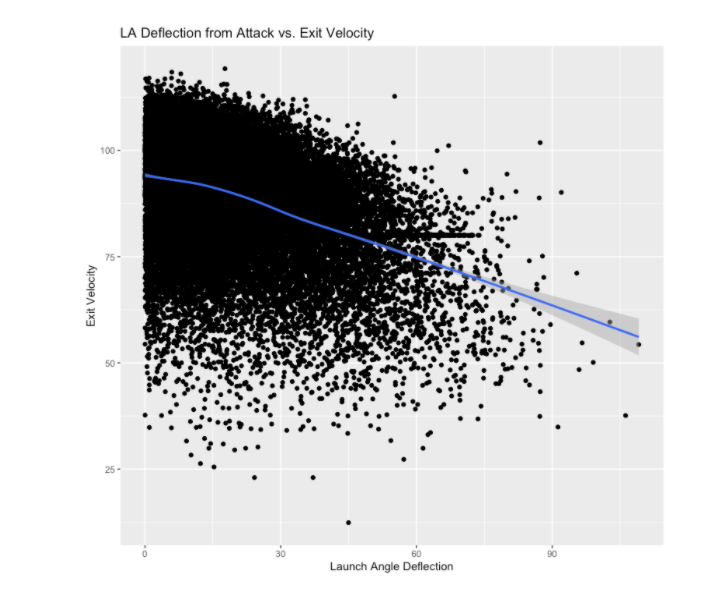 The more a ball is deflected away from a player’s attack angle, the more velocity they will lose, and maximal exit velocities are clustered around a deflection of 0°. Taking that into account, the gap in barrel rate between Cron and Galvis begins to make sense, particularly once we add Max EV to the equation. 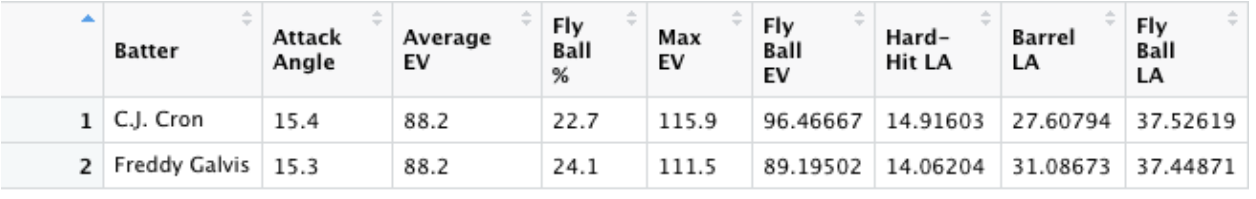 Neither Cron nor Galvis has a very steep swing, so both players will need to go through quite a bit of deflection to produce a Barrel (defined by Statcast here). The problem for Galvis, then, is that he hits his fly balls at an average of 22° away from his attack angle! Using our modeled relationship between deflection and exit velocity, that produces a loss of more than 9 MPH off his maximum exit velocity. That effectively limits him to a maximum possible Fly Ball exit velocity of just 102 MPH, good for 280th in the MLB last year. It’s no surprise, then, that his average hovers around 89 MPH on fly balls, producing a hit probability of just .027! Average exit velocity is not terribly predictive, but in this case tells us the quality of contact Galvis can expect more regularly when deflecting the ball into the air. Starting with a lower Max EV, he simply cannot afford the decrease in exit velocity required to put the ball in the air swinging as he does. Cron, on the other hand, hits the ball harder, which means he has more exit velocity to “lose” as his launch angle increases, producing way more Barrels. He has more behind his fly balls, and with the swing discipline to stay in his (albeit smaller) wheelhouse, he is a more efficient and effective power producer with a nearly identical swing and batted ball profile. 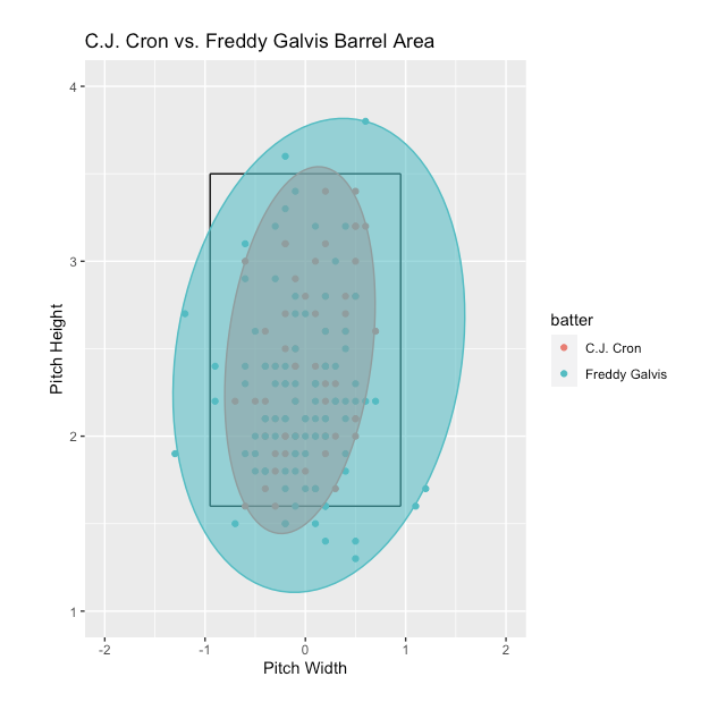 Being able to control the zone is helpful, but if expanding the “wheelhouse” compromises contact quality and creates more mishits, that coverage will not translate to production. Galvis has an above average barrel spread, but the vertical and horizontal deflection that more swing-happy approach generates hurts his ability to punish those pitches. If you cannot hit a pitch hard consistently, swinging at it is unlikely to do you much good. Ranking the variables we’ve discussed so far by their correlation with Barrel rate shows us this: 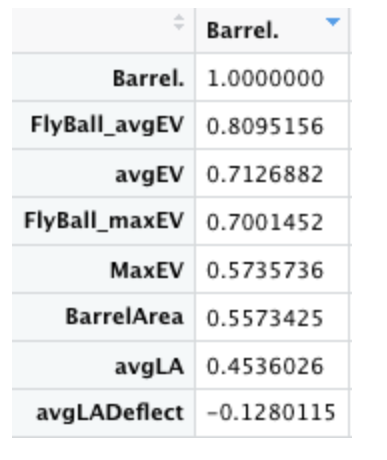 We know we must hit Barrels to produce at a high level, so hitters need to prioritize how hard they’re hitting their fly balls. If you can get the barrel to any pitch chalk to chalk but can’t drive them in the air with much authority, you’re facing an uphill battle to be successful. This is an important realization that could nuance the way we think about swing path. In my experience, we tend to want to reserve steep swings for powerful hitters who can “afford” to hit the ball at higher angles because they have the exit velocity to turn those fly balls into homers and extra base hits. What Galvis’ production screams to me, however, is that it's guys without superhuman strength who could benefit the most from trying to induce a little more loft with a steeper swing. It is nonnegotiable that balls must be hit hard and in the air to maximize production, but a flat swinger cannot do that without compromising exit velocity.  (Exit velocity to spare, Exhibit A. Attack Angle: 12°)
Hitters without exit velocity to spare would be best served by training attack angles that preserve exit velocity on fly balls by matching the desired launch angle. Put simply, if you want your hardest hit balls launched between 18° and 30° (where the most valuable batted balls are hit), you should think about swinging nearer to that range -- plate coverage be damned. By: Noah Thurm Successful pitchers limit damage by minimizing the quality of contact they allow. How they can best do that remains up for debate, with pitchers focusing on some combination of deception, movement, and location to try and miss barrels. I propose that the most important pitcher-influenced variable to quality of contact is Launch Angle, and understanding and influencing it ought to be a near-top priority for all pitchers. It is clear that Exit Velocity is the single most important predictor of a batter’s success, but that relationship cannot be manipulated much, if at all, by any pitcher. Across Major League Baseball, batters’ Exit Velocity distributions are much tighter than their Launch Angle distributions. This means pitchers are likely better able to directly influence Launch Angle than Exit Velocity, which is quite “sticky” around the mean for a given hitter. No amount of talent on the mound can rob Giancarlo Stanton of the strength that produces 120+ mph homers, but that doesn’t mean his production cannot be neutralized. Alex Chamberlain of RotoGraphs recently explored this idea at great length, coming to much the same conclusion. This, to me, demands a new pitching approach centered around what I call “Launch Angle Deflection,” or the attempt to induce weak contact and get outs by “deflecting” batted balls to extreme (and therefore suboptimal) launch angles. A recent thread by Tom Tango (@tangotiger) illustrates this quite well, where each line represents an 8-degree “group” of launch angles. At either end of the launch angle spectrum, batted balls closer to the edge produce lower wOBA at all Exit Velocities. 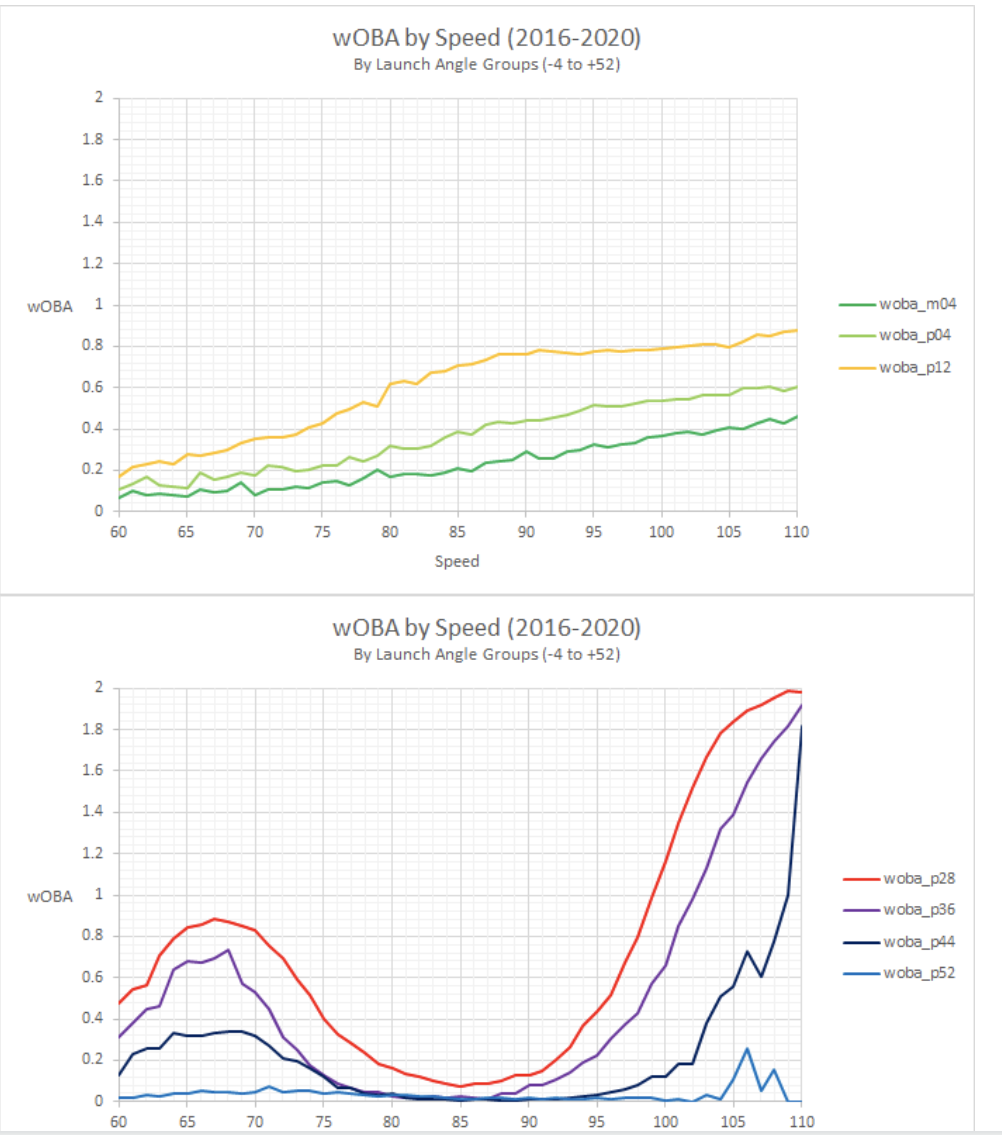 https://twitter.com/tangotiger/status/1291001207633448961?s=20 To quickly recap:
If influencing Launch Angle is the key to limiting damage and getting outs, how can a pitcher do so? To answer that, I ran a series of Variable Importance tests on a number of different pitching metrics to determine which have the greatest impact on Launch Angle. Analyzing every batted ball in the Statcast Era through 2019, the results were clear: the most significant variable to Launch Angle across pitch types and irrespective of pitcher handedness was pitch height. The results from RHPs’ Four-Seam Fastballs exemplify this, and the rest can be found at the link below. The top four variables by importance are all related to the height of the pitch and eat up the vast majority of the statistical significance to launch angle. 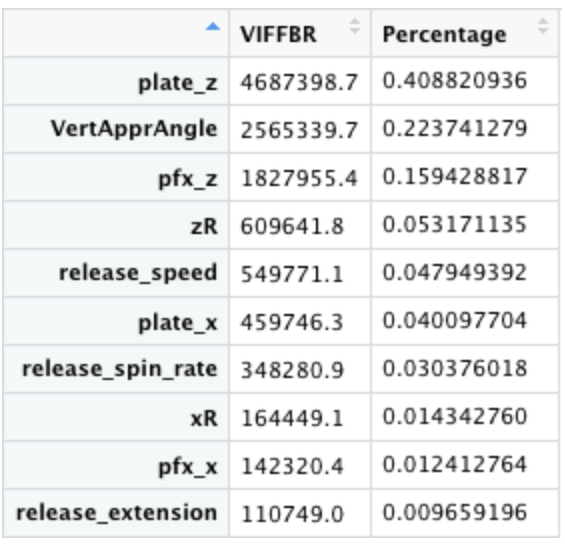 Represented graphically, we can see that pitches of all types up in the zone tend to produce higher launch angles, while most ground balls occur on low pitches. 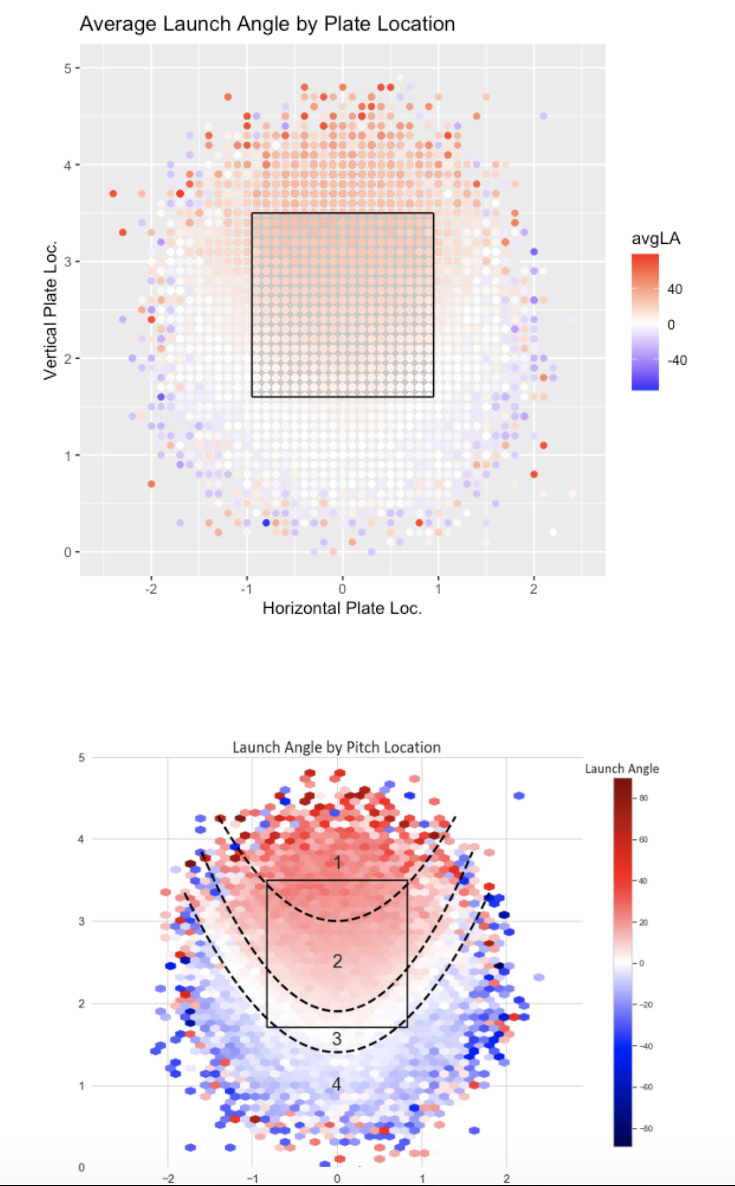 This visual above from Connor Kurcon groups launch angles into curved bands Putting it all together, the suggested pitching strategy is to push hitters to the nearest extreme of Launch Angle given their average. This could look radically different depending on the hitter, which I’ll explain using two players with similar exit velocities on quite opposite ends of Launch Angle: Joey Gallo and Eric Hosmer. 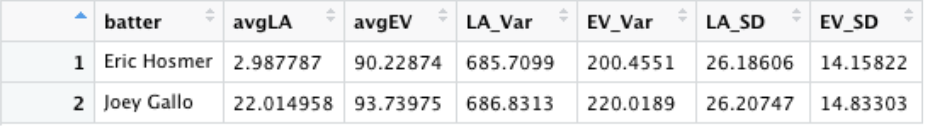 Looking at each player’s batted ball distributions is helpful as well: 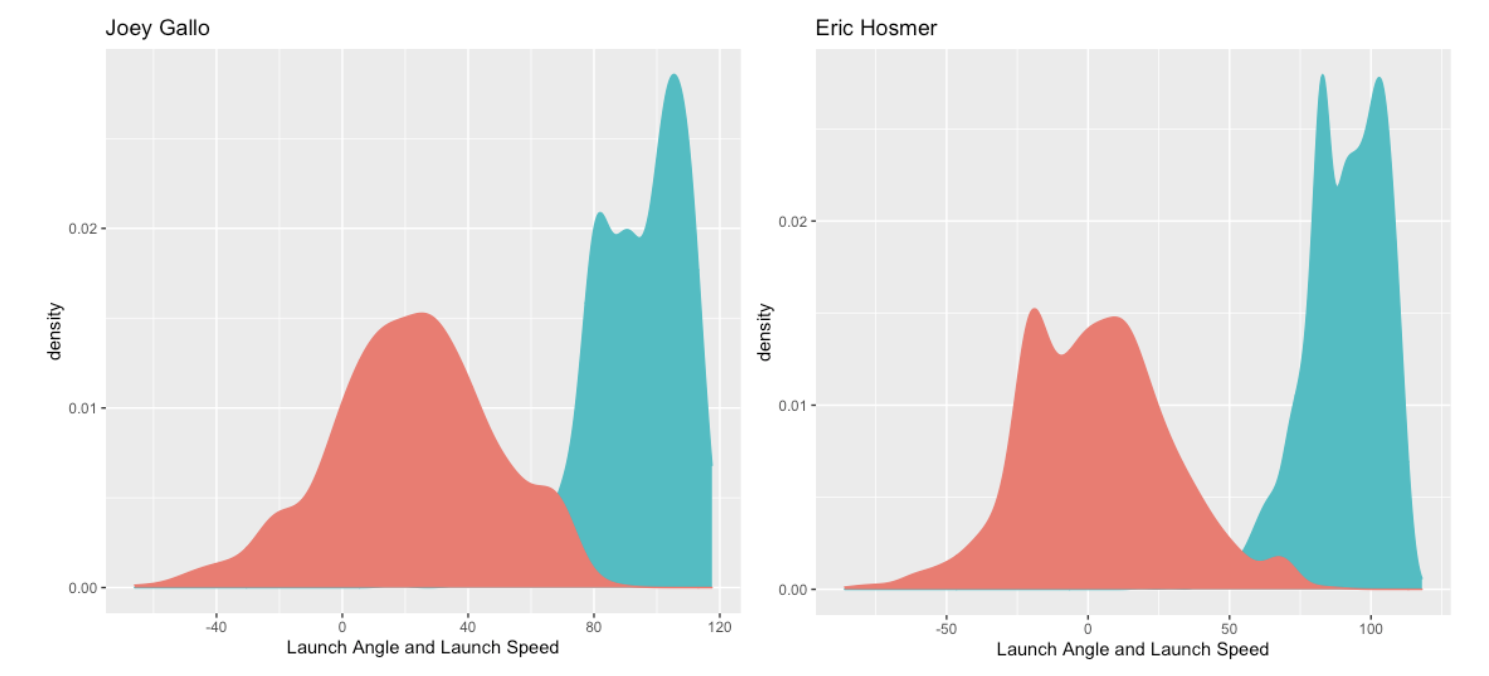 The two have EV distributions that look quite similar (in blue), but Hosmer’s launch angles are centered much lower than Gallo’s. This means we need different approaches to pitch to each player. Starting with Gallo, that 22° average LA puts us much closer to extremes on the high end of LA, suggesting primarily pitching up in the zone. This may seem counterintuitive for a guy with Gallo’s home run pop, but trying to keep him “in the park” by inducing ground balls forces a pitcher to try and pull him through the most dangerous launch angles in the middle to get to comparatively harmless single-digit and negative LAs. Looking at his xBA by Launch Angle and pitch height makes this easier to understand: 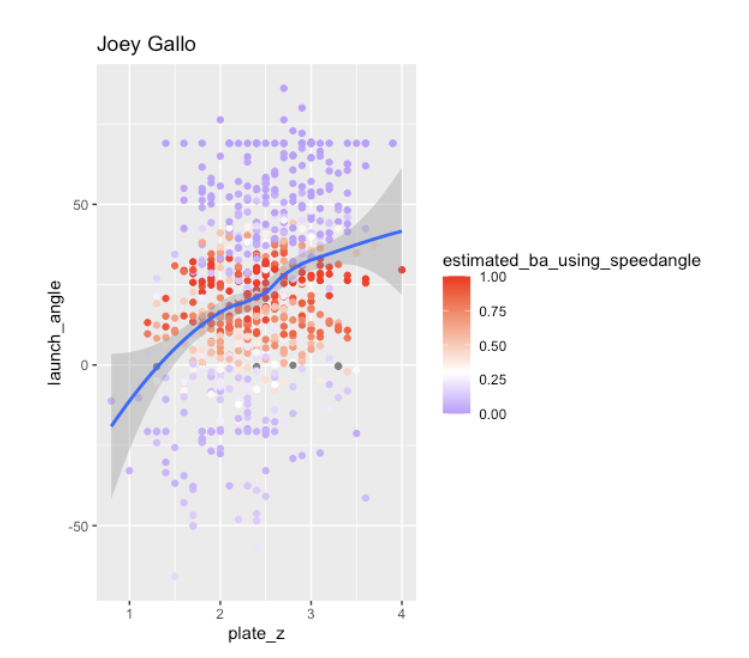 The place where low-damage batted balls lie closest to the trend line between plate height and launch angle is at pitch heights above ~2.75. Pitches there don’t require a mishit or uncharacteristic outcome to get outs, they generate launch angles that neutralize his power. Trying to get Gallo on the ground by pounding the bottom of the zone leaves far less room for error, as there are plenty of high xBA balls below the trend line. Hosmer, on the other hand, is far more susceptible to that same low-ball strategy because his nearest extreme of Launch Angle is the negative range where ground balls (i.e. outs) occur. Looking at the same chart for Hosmer confirms this: 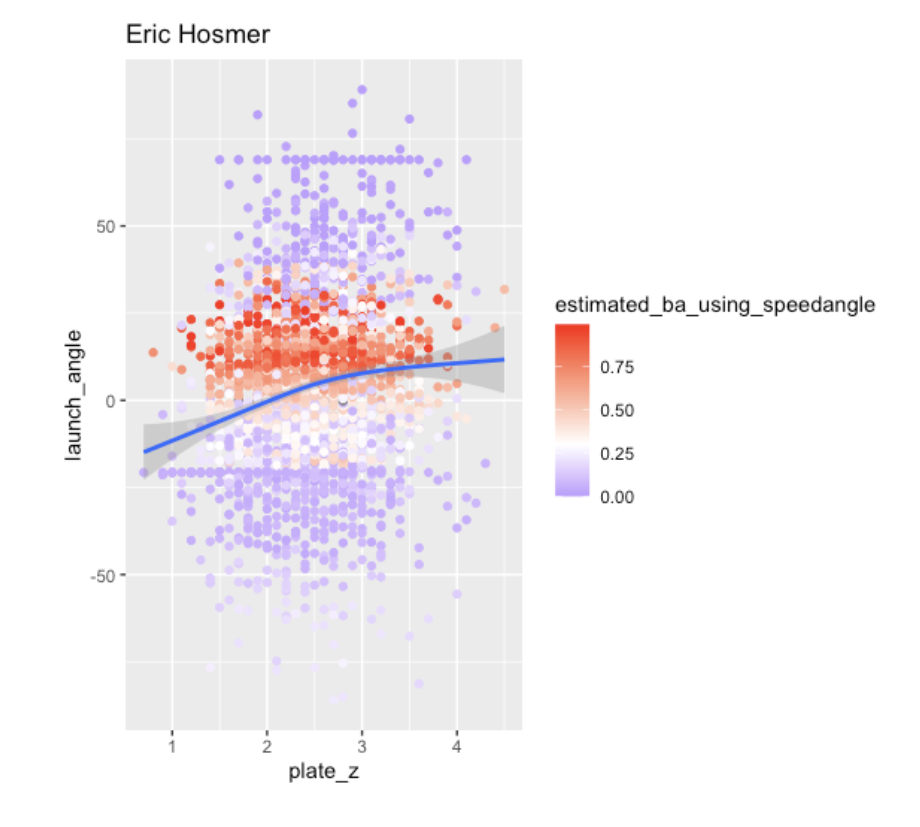 Hosmer’s average LA is so low that pitchers should stay out of the top of the zone where he is more likely to elevate and succeed beyond his average. Hosmer’s batted balls with the highest xBA are concentrated above the trend line, meaning like Gallo, pitchers should lean into his tendencies and go the other way, relying on pitches breaking and finishing down in the zone to produce contact that will not hurt them. Deciding which players should be pitched in each direction is a challenge all its own, and the “break point” will shift based on a pitcher’s and staff’s priorities. If the goal is to limit the damage done by an average batted ball, I’d posit a “break point” around a 20° average Launch Angle. Given a game situation where a pitcher is more interested in limiting the damage of an especially hard-hit ball, the threshold for attacking up in the zone ought to be higher. At EVs above 100MPH, xWOBA increases with every degree of launch angle between 8 and 32. In trying to mitigate this worst-case scenario, a pitcher may be more comfortable trying to push a batted ball from 20° to a less dangerous 8° than to 32° by going through 12° of more dangerous territory. With a final assist from Tom, we can see this xWOBA variability in the middle ranges of LA: 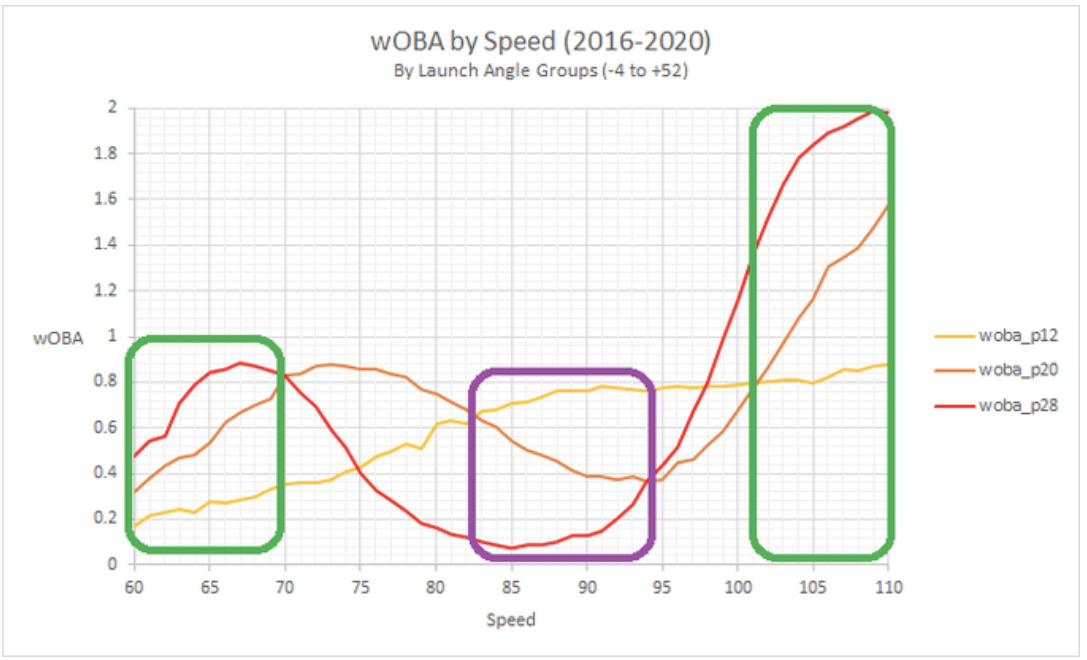 This is why we’ve seen a huge wave of successful high-efficiency fastballs pounded up in the zone from pitchers like Justin Verlander, Gerrit Cole, and Lance Lynn. At exceptionally high EVs they risk giving up home runs, but the tremendous whiff rates and weak air outs they generate are hugely beneficial. In practice, I think these findings suggest teams move away from a “heatmap” approach to attacking hitters by throwing to colder EV spots. Exit Velocity is far more resilient than Launch Angle to location and pitch execution and Launch Angle provides a clearer path to limiting the quality of contact -- and ultimately runs -- a pitcher allows. Outs don’t all need to be weakly hit, and with a smarter, vertically-oriented approach, pitchers can get more outs at any Exit Velocity. 1 Curveballs and Sinkers returned vertical break in the top spot, which is the physical means to the end of pitch height, and not a significant exception in my mind.
2 Full test results available at: https://rpubs.com/njt17/647088 3 @ckurcon on Twitter : https://twitter.com/ckurcon/status/1285629595337789441?s=20 By: Noah Thurm Our main goal of the coaching staff and analytics group is to create the most practical and applicable use of data, so the players can quickly and readily use the data provided. We continually search for ways to translate data into results. This is just another great instrument developed here that quickly helps players get better results. From the coaching side the ability to communicate effectively and efficiently is huge. Not all players want to hear about the x, z, or y movements, but all players want simple demonstrations of how to get better, this is one way we strive to do so. A ton of credit goes to our entire Student-Manager staff! -Pitching Coach Eric Niesen “Pitch Design” has become fully part of the modern baseball vocabulary, but the concept in and of itself stops short of prescribing an effective player development approach. It takes the right combination of goals, measurements, and cues to guide an athlete towards a desired outcome. In most cases, all of the analysis in the world is ineffectual if it is not communicable to the player and applicable to practice. All players, regardless of their knowledge or interest in the role of spin characteristics, should be put in a position to understand their arsenal and take control of their own development. This puts the onus on an analytics staff to decipher complex pitch components and present concise, goal-oriented training approaches to coaches and players. One of the most important metrics to understanding why pitches move the way they do is Spin Efficiency, or the percentage of a pitch’s total spin that is in the x (back spin) or z (side spin) direction. More simply put, this is the percentage of the spin on a pitch that will influence movement, because spin in the y direction (gyro or football spin) does not. While it says nothing of Axis of Rotation or Spin Direction, Spin Efficiency makes a good starting point for pitch design and lends itself to broadly applicable ranges for each pitch type. For example, a fastball with true backspin will be 100% efficient, maximizing the amount of vertical break for a pitcher’s given spin rate, giving the illusion of “lift” or “carry” on the fastball. As efficiency comes down, less of the pitch’s total spin is converted to movement, and the pitcher loses some of that deceptive effect. Rather than shift the responsibility of understanding the complex relationships between spin characteristics and movement onto the athlete, the approach we’ve begun to take at Georgetown is developing “target zones” for each pitch in a player’s arsenal that allows them to quickly digest whether progress is being made throughout a single bullpen, outing, or an entire season. Much of what will ultimately change Spin Efficiency, Direction, and Axis occurs just before release, and it may be unrealistic to expect many athletes to be able to focus intently on their hand and wrist position every pitch while still performing at a high level. The target zones allow both coaches and players the flexibility to find what cues work in a practice setting while still making those crucial micro-level improvements. Putting our target zones of Spin Rate and Spin Efficiency right next to a similar map of each pitch’s movement makes clear to players the interplay between a pitch’s “internal” spin characteristics and “external” movement pattern. 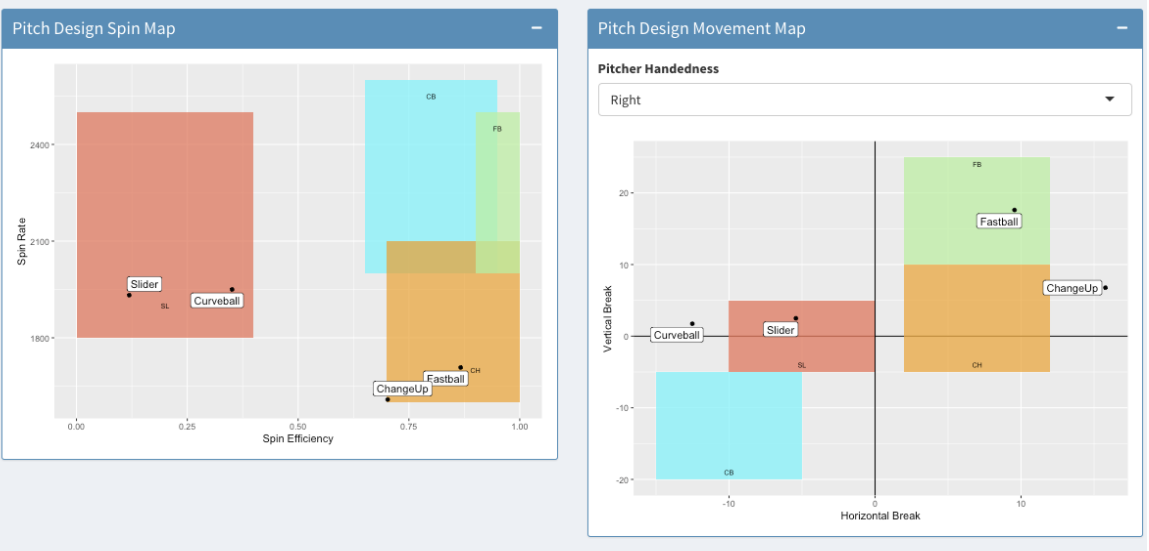 Calculating and analyzing those “internal” characteristics helps explain many of the results visible on the field, and confirm the conclusions a player or coach may draw from the “eye test.” It can also uncover important insights that help orient an individual development approach. Take the following pitcher as an example. The athlete is a high-level arm, and a consistent starter at the collegiate level. A closer look at his arsenal’s spin characteristics, however, reveals potential areas for improvement: 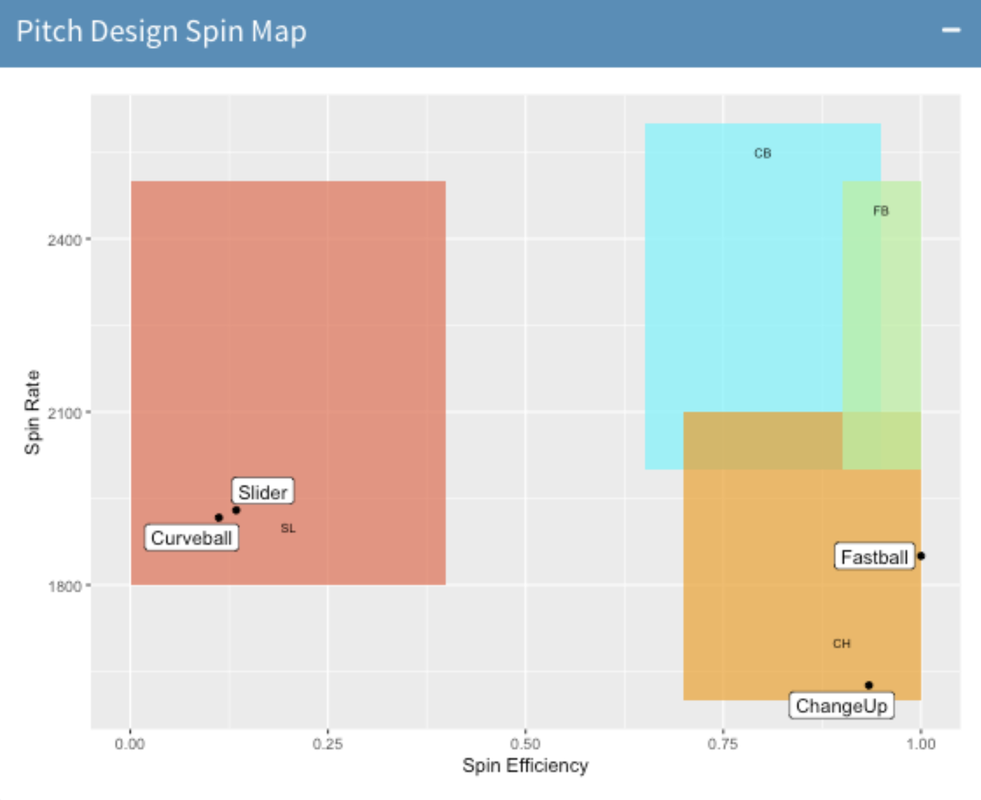 This pitcher’s Slider and Curveball are nearly identical in spin rate and efficiency, and their similarity is confirmed by a look at the corresponding movement map: 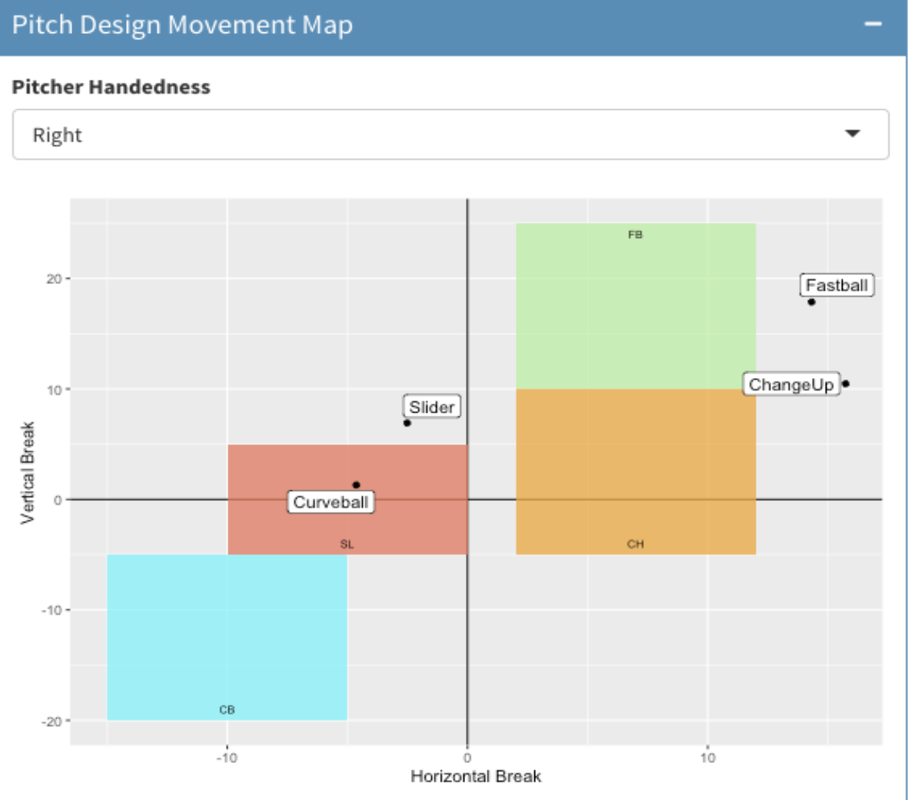 And when using a trajectory visualization tool, in this case Driveline EDGE: This has a few important implications. First, athletes have limited training time and effort available for pitch design, and spending equal training economy on two different pitches that have identical characteristics is an inefficient use of practice. This player would be better served improving one pitch at the expense of the other rather than continuing to throw both equally. Second, if a coaching staff is not familiar with their pitcher’s arsenals to this level of detail, they may use call pitches relying on a differentiable Slider and Curveball. In reality, these two breaking pitches are nearly indistinguishable to a hitter out of hand, with only slight variation in Spin Axis to separate them. This puts an uninformed staff at a disadvantage with a solid starter on the mound, and clearly demonstrates the necessity of going beyond the “eye test” in pitch design. For this pitcher, creeping up towards the low end of our “target box” with his curveball would dramatically alter the look and deceptiveness of his arsenal. Once breaching the 70% spin efficiency threshold we’ve laid out, his breaking pitches would take on significantly more life (Fastball included for reference): There’s no doubt that the dozens of pitch characteristics returned by systems like Rapsodo and Trackman can seem isolated and difficult to utilize on their own, but given the proper context and with appropriate comparison, we can make sense of their role -- and more importantly -- how they can be manipulated to make players better. This is true of analytics teams, coaching staffs, and players alike. Packaging complex analysis in digestible, goal-oriented visuals like our targets holds the greatest potential for development and ultimately on-field success.
While the season came to a halt much faster than anticipated, our analytics team has capitalized on the situation to further our existing projects and brainstorm new, innovative ideas.
First, we want to acknowledge all of the dedication that our student athletes have shown over the past year. While it is unfortunate that the results could not be seen on the field, we are looking forward to seeing the progress of continued hard work next year. For the analytics team, this time has served as a great opportunity to continue working on some of our long-term projects. The break in activity has allotted our team more time to continue researching new trends in analytics and incorporating the use of new platforms like R Shiny. Since we have not been able to meet in-person since March, the group has been coming together on Zoom, allowing us to continually develop ideas and push forward. Earlier in the spring, our team met with the pitching staff to discuss ways to make data more accessible and develop an effective way to distribute information during the season. From there, our team has been working on ideas such as a points system based on on-field results to track and compare results. Although the landscape of summer baseball has been significantly altered due to the pandemic, the existing platform that our team has worked on this past winter where players access information for workouts has been continually improved and put to good use Under this system, it is easier for the team to develop familiarity with the structure before stepping on campus. Overall, the analytics team has been hard at work exploring concepts such as a pitch grader and developing weekly reports which are more accessible for the team. Although the lack of time together on campus was unexpected, it has provided an opportunity for the group to sharpen our skills and come back with new innovative ideas for next year. We look forward to sharing some of these concepts we are digging into during this time here on the blog. Hoya saxa! It’s well understood that a repeatable delivery helps a pitcher. It may contribute to deception by disguising pitches longer as well as arm health and longevity by avoiding new and unexpected stress on the arm. In modern baseball parlance, “tunneling” is as widespread and desired an attribute as any other, and one look at a PitchingNinja overlay makes it clear why. Elite pitchers excel at repeating their release point and the first few feet of ball flight, and new tools like Driveline Edge allow for measurement and testing in pitch design for all players. While there’s little debate about the benefits of consistency, considerably less has been done in regards to the precise pitch result and swing outcome effects of greater release repeatability and “tunneling.” Knowing more about the expected improvement in outcome from a change in a pitcher’s release pattern gives us a better guide to contextualizing release point data across outings and see how it translates to in-game performance. In trying to develop a useful comparison, the outcome reference point I first settled on was swing rate -- with the intuition being that the better a pitcher “tunnels,” and the more consistent they are at release, the higher the swing rate on their primary offspeed pitch would be. Using data from the 2020 season, my initial results did not conform to that hypothesis. Charting swing rate against the pythagorean difference in release point compared to each pitcher’s fastball {Sqrt[(HeightFastball - HeightOffspeed)2 + (Horiz. PositionFastball - Horiz. PositionOffspeed)2]} returned a surprisingly inconclusive result. 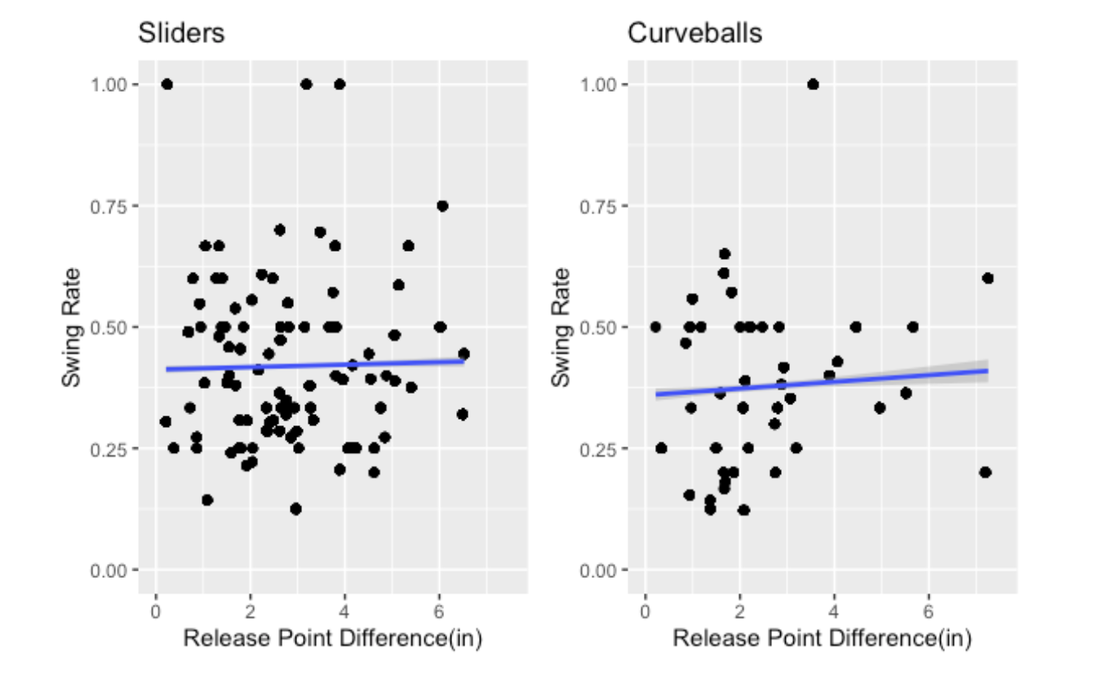 There was no compelling relationship visible in the data, and tests of the bivariate pearson correlations confirmed this, with Sliders having r = .079 and Curveballs coming in at just r = .110. This seemingly flew in the face of the conventional wisdom, and the relationships were no stronger when testing against swing and miss or chase rate alternatively. The anecdotal and experiential evidence in favor of a more repeatable release having an appreciable positive relationship with swing outcomes is strong enough that it warranted further investigation, and resolving deviation from average Fastball release position into its vertical and horizontal components significantly changed the tests’ results. Once release height and horizontal position (“Release Side” per Trackman) were isolated and tested independently the data began to confirm my suppositions and general intuition. 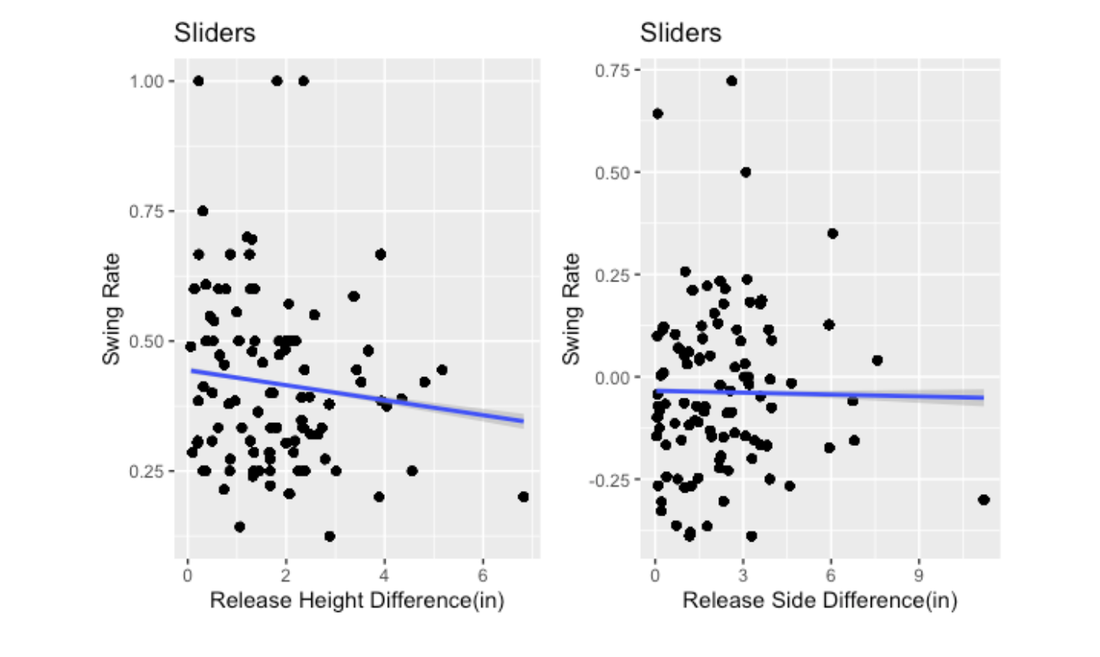 Starting with Sliders, splitting height and side revealed that release side has little appreciable effect but release height does have the expected relationship with swing rate. Compared to the combined r value of just .079, release height returned r = -.295 with swing rate. Applying the same process to Curveballs produced an even more impressive outcome: 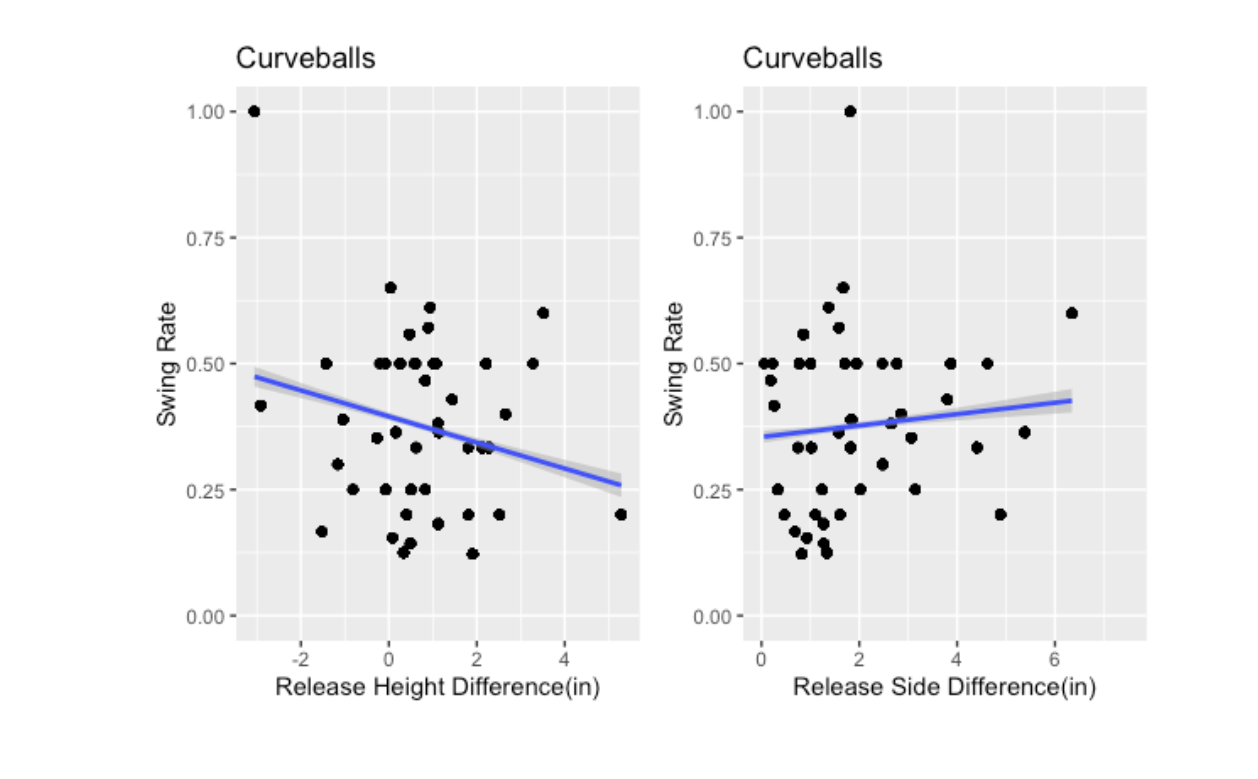 The plot shows an even stronger swing rate dependence on release height, with r = -.327 compared to a relatively inconclusive positive relationship with release side. This exaggeration in result for Curveballs was not surprising, given their relative ease of identification compared to most sliders. The tendency of a curveball to “pop” up out of the pitcher’s hand aggravates the effects of a difference in release point and trajectory, placing a greater emphasis on releasing a curveball at the same height as a pitchers’ fastball. Having a different release point as well as a different look out of hand predictably fails to fool a hitter, minimizing the effectiveness of the Curveball. That said, those unique Curveball release characteristics can have other benefits for a pitcher, particularly so in regards to producing looking strikes. The benefits of release consistency seem to be turned on their head when looking at strikes taken, with height and side deviations contributing to more looking strikes: 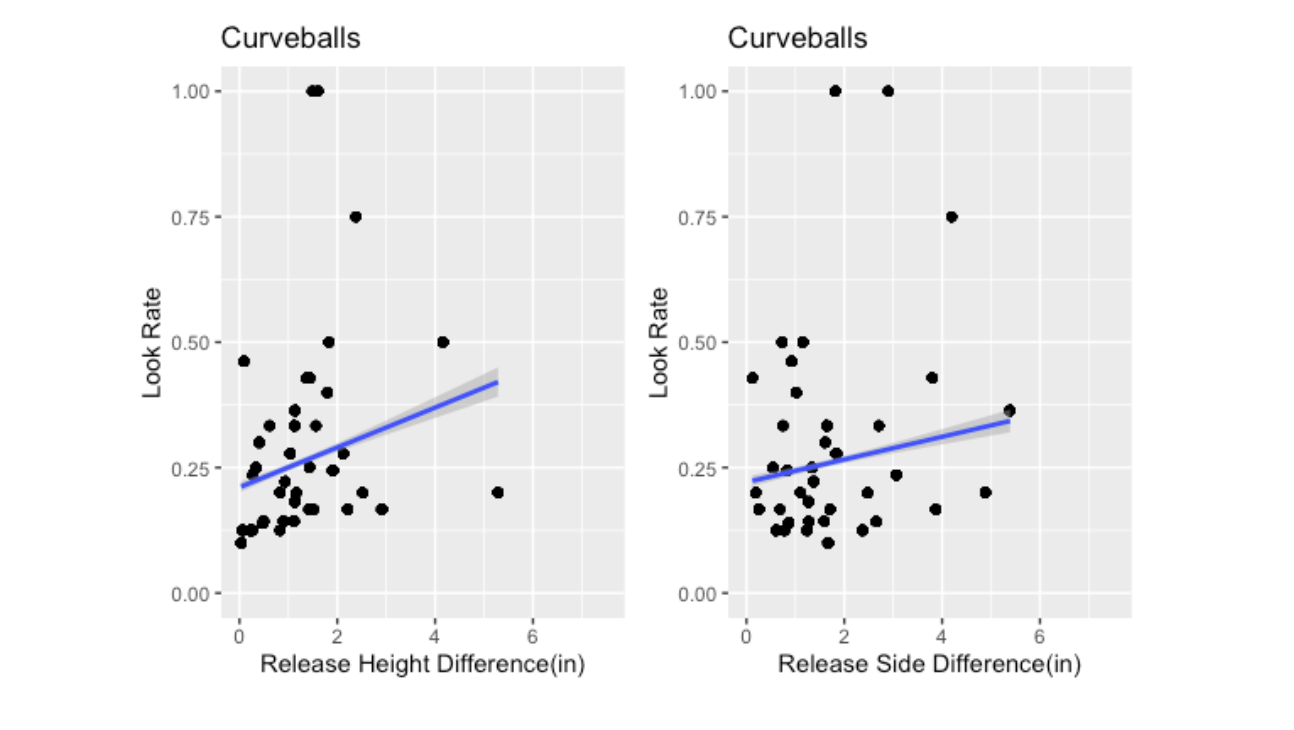 This is certainly something to keep in mind for pitch design, as a sufficiently different “look” to an offspeed pitch may surprise or freeze a hitter and steal some strikes. In assembling an arsenal, it may be beneficial to have the best of both with a well-disguised Slider and a change-of-pace Curveball as weapons.
All that said, both the data and statistical relationships were fairly constrained, leaving wide confidence intervals and necessitating some deeper analysis. I would expect the relationships between pitch consistency and swing outcomes to be strengthened by looking at the first few feet of flight rather than just release, allowing for elite “tunnelers” to separate themselves from the pack and produce a more convincing statistical result. Moving forward, it appears that release height is king when it comes to deception, allowing some wiggle room in horizontal release position to accommodate a player’s habits and feel. Despite the temptation to do so, it may not be beneficial to try and eliminate a pitcher’s tendency to change slot or arm angle on their offspeed pitches as long as height is well matched to their fastball. 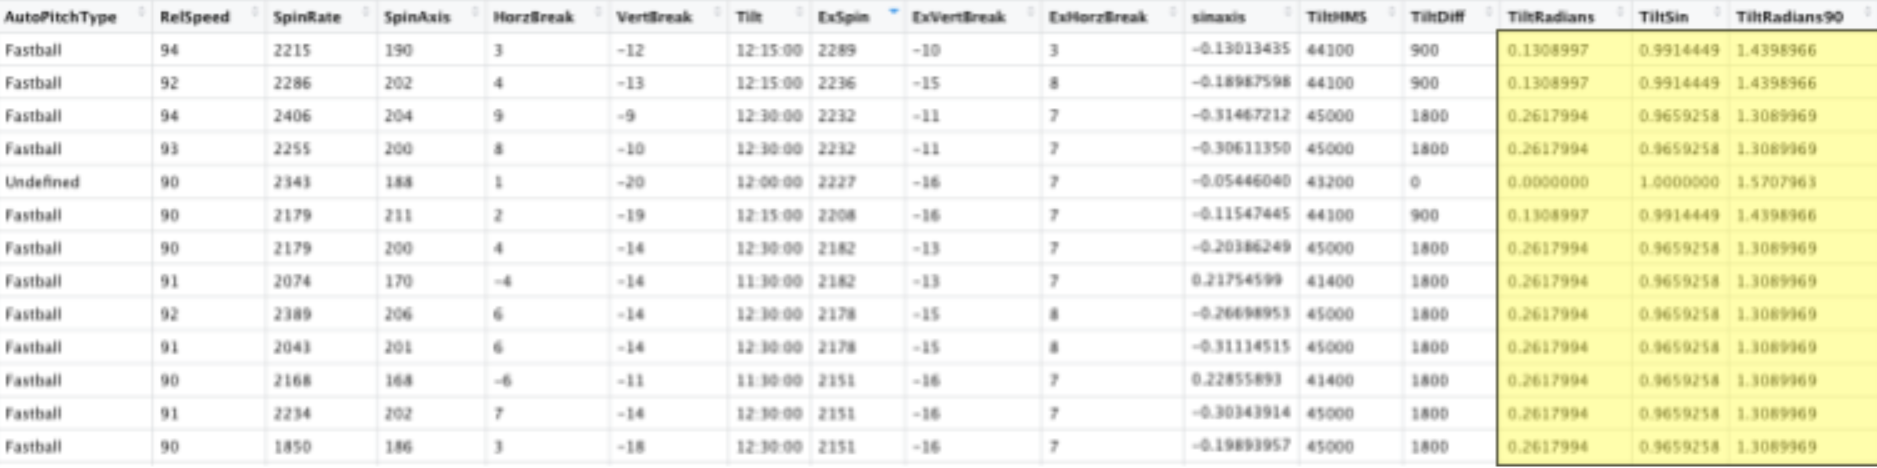 By Noah Thurm In throwing a fastball, all spin is not created equal. Although it is well understood that higher spin fastballs induce more swings and misses, fly balls, and weak contact than a low-spin fastball of the same velocity, that simple analysis has two crucial shortcomings from a player development perspective. First, spin is as close to an inherent characteristic as there exists in pitchers, making it exceptionally difficult to train. As much as we might like to be able to skyrocket a pitcher’s spin rate, short of employing foreign substances there isn’t much to be done. It will improve with added velocity, but the ratio between a pitcher’s velocity and spin is all but fixed. Second, the benefits enjoyed by high-spin pitchers on their fastballs depend not just on how well a player spins the ball but on how much of their raw spin is converted to vertical movement. Spin resists the downward pull of gravity by generating lift via the Magnus Force, giving high-spin fastballs the illusion of “rising” as they reach the zone. However, only the spin that is around a horizontal axis, called transverse spin, contributes to backspin and lift. So, where does this leave us? While we may not be able to do much about a given pitcher’s spin rate, if we can understand how much movement he is getting, and more importantly, how much he should be getting we can develop a novel training and pitch design plan. The dilemma we are left with then is this: who gets the most out of their fastballs and who can improve. To help with this, we developed a new composite metric based on prior research by Driveline Baseball called “Pitch Potential Percentage.” Drawing on over 200 pitchers’ worth of data from the 2020 season, we built a model for predicting the spin rate and vertical movement of an average pitcher’s fastball given a velocity and release characteristics. To nail down a prediction for vertical movement, we find an expected transverse spin rate. By taking averages at each velocity and multiplying by the sin of the tilt in radians we can isolate the vertical component of the pitch vector and hone in on vertical break. Having an “expected” spin rate and vertical movement lets us compare our pitchers’ metrics to an average D1 pitch and see who has the potential for growth. Particularly, we were interested in players who are not getting the most from their spin, and therefore don’t have as effective a fastball as they could. That’s where Pitch Potential Percentage, the difference in percentile rank for a pitcher’s spin rate and vertical movement compared to the model’s prediction at their fastball velocity, comes in. The players with the highest Percentages are guys whose spin performs significantly better against the model than their movement, tipping us off that with some tweaks to wrist, hand, and finger position at release we can alter the pitch’s axis and movement profile. 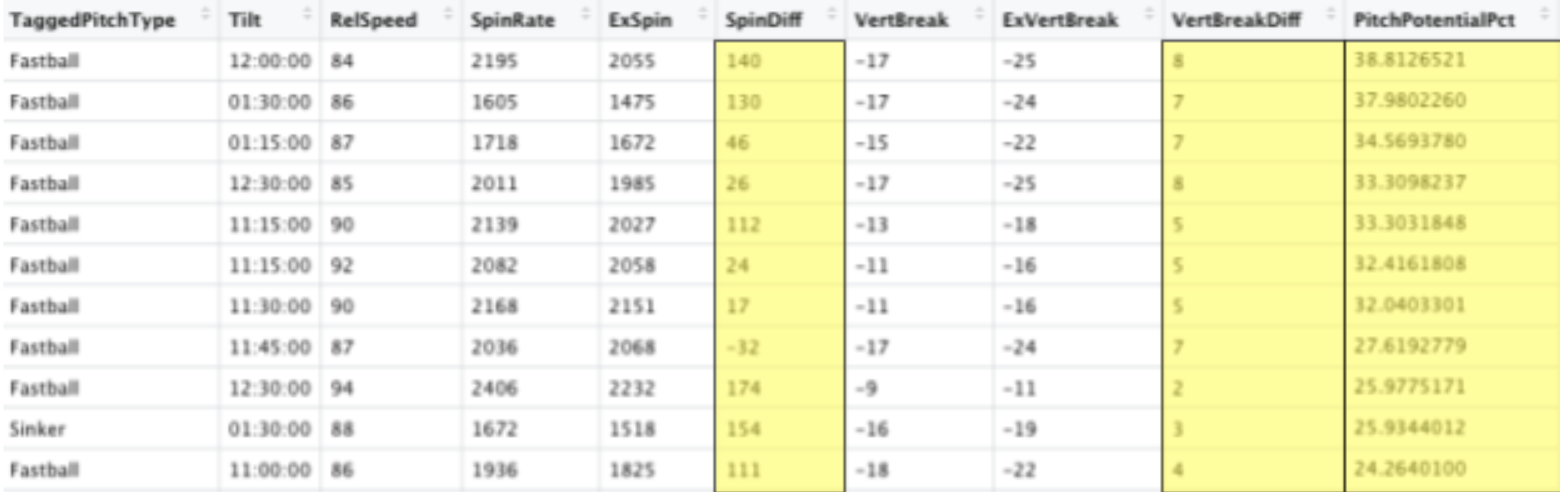 Pitch Potential Percentage isn’t a silver bullet though, as there are certain pitchers who may not want to maximize vertical movement. Sinkerballers, for instance, throw with very little transverse spin and might be hurt by adding an extra inch of lift to their fastball, and cutter-dominant pitchers may thrive by generating gyro spin and horizontal movement. 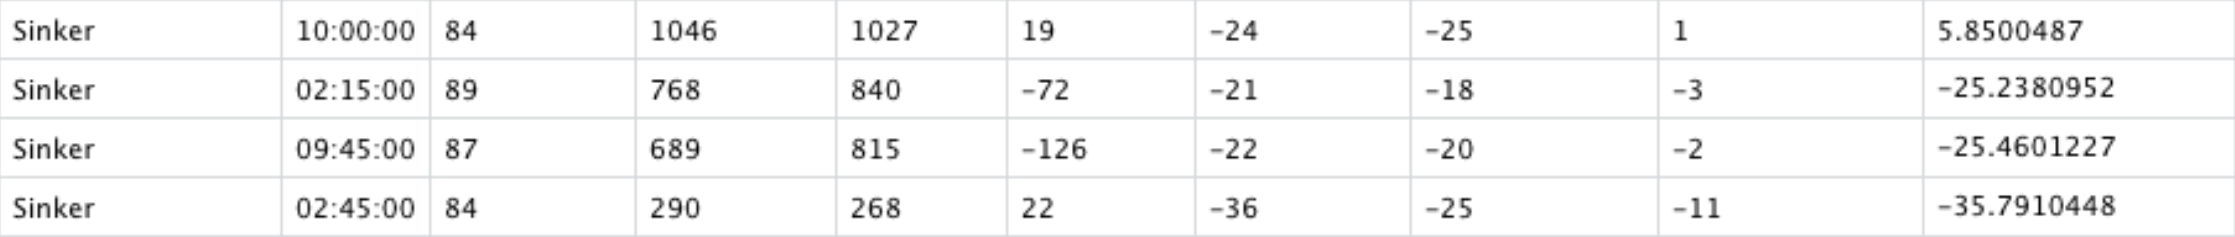 For the pitcher who is throwing a true four-seamer and is looking for an extra edge, Pitch Potential Percentage may tell us how we can squeeze out every bit of performance possible today. Moving forward, we’ll look to track progress towards a potential of 0, and see how similar methodologies can be applied to breaking and offspeed pitches.
Welcome to the Georgetown baseball analytics group! We are a newly formed team of students with a passion for baseball and numbers. Under the leadership of the Georgetown University baseball pitching coach, Eric Niesen, we hope to help the coaching staff make informed decisions to improve team success both now and in the future.
A huge part of our early impact has been achieved through the substantial investment made by the program in the technology and tools that help us do our job. This fall, we implemented and experimented with a number of systems, including hitting and pitching Rapsodo units, a Flightscope, and, ultimately, a Trackman system, making Georgetown the first Big East program with the cutting edge technology. Having access to ball flight metrics for every pitch thrown at Shirley Povich field far extends our analytical capacity, enabling deeper investigations of player performance. We are excited to collect more data throughout the year and identify salient trends and performance indicators. With data obtained from Trackman, we are able to extract and visualize relevant data using R. Using a series of code, we can create reports for our pitchers and hitters for every game, as well as reports that display a defined period of time. Our staff utilizes the reports to improve in four key aspects: player development, recruiting, scouting, and in-game decision-making. The coaching staff can use information from player reports to help identify what athletes need to improve. For example, pitch reports show the release point of every pitch thrown by the pitcher, which Coach Niesen can use to aid a pitcher in improving their release point to avoid injury and better disguise the pitch being thrown. Additionally, hitters can visually observe what pitch types and locations they perform well against, along with what they struggle against. Based on this information, the coaching staff can observe the strengths and weaknesses of each player, and the staff can determine what they need in a recruit when a current player leaves the team. We also utilize R to provide team and individual player scouting reports for opposing teams. Knowing the strengths and weaknesses of opposing players can be a big strength to our coaching staff as it provides them with the information to make informed in-game decisions. We also hope to aid the Georgetown offense by creating an algorithm that determines each opponent’s likelihood of throwing a certain pitch in a specified count after a specified result. In general, we hope to discover trends in opposing teams that our coaching staff can exploit. This leads into the decision-making aspect of our team. By knowing our team’s skills as well as those of our opponents, our coaching staff can make informed decisions in every aspect of the game, from batter approaches to a certain pitcher, to defensive shifts, to what pitch each opposing hitter struggles with. As we improve our coding and analytic skills, our team hopes to expand to some new projects, such as predictive modeling of opponent pitch calls, or quantifying injury probability by looking at release point consistently and velocity trends through games. We hope to be able to support Coach Niesen’s daily arm health rating system with data collected from the Trackman, reinforcing our ability to spot worrisome signs and keep our guys on the mound. We cannot wait for the baseball season to be in full swing, and we hope you stay tuned to watch the growth of our team. Hoya Saxa! |
AuthorWrite something about yourself. No need to be fancy, just an overview. Archives
August 2020
Categories |

 RSS Feed
