
|
By: Noah Thurm If you’ve got it, you might as well throw it. Even as league-wide velocity has trended upwards (up to an average of 93.4 MPH in 2019), pitchers are increasingly turning to their offspeed pitches to get outs. The heavy reliance on breaking pitches bucks the traditional idea of “saving” your best pitch for strikeouts or dangerous situations, and league-wide data seems to support this shift in approach. To flesh this out, I compared year-to-year changes in usage rate with the corresponding year-to-year change in whiff rate for every Slider thrown since 2015. Somewhat surprisingly, there is no convincing evidence of a reduction in effectiveness when use increases. 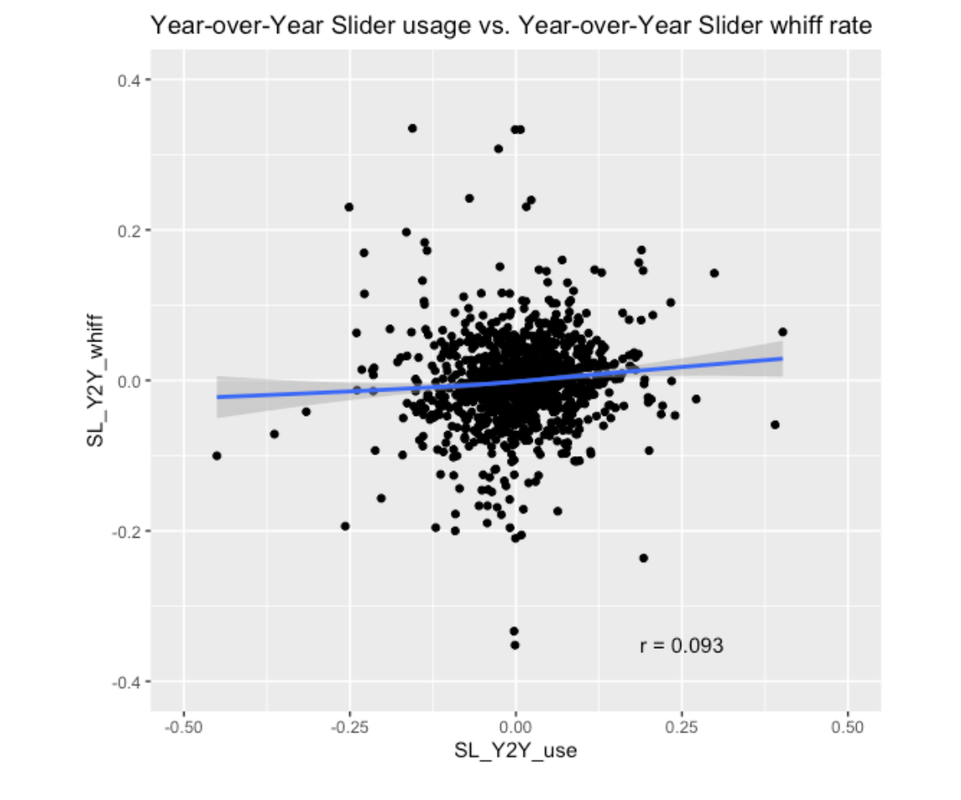 Naturally, most players are clustered around changes of 0, but across the board guys who make big jumps in Slider usage see no consistent downward trend in whiffs as we might expect. Even isolating the extremes returns much the same result: 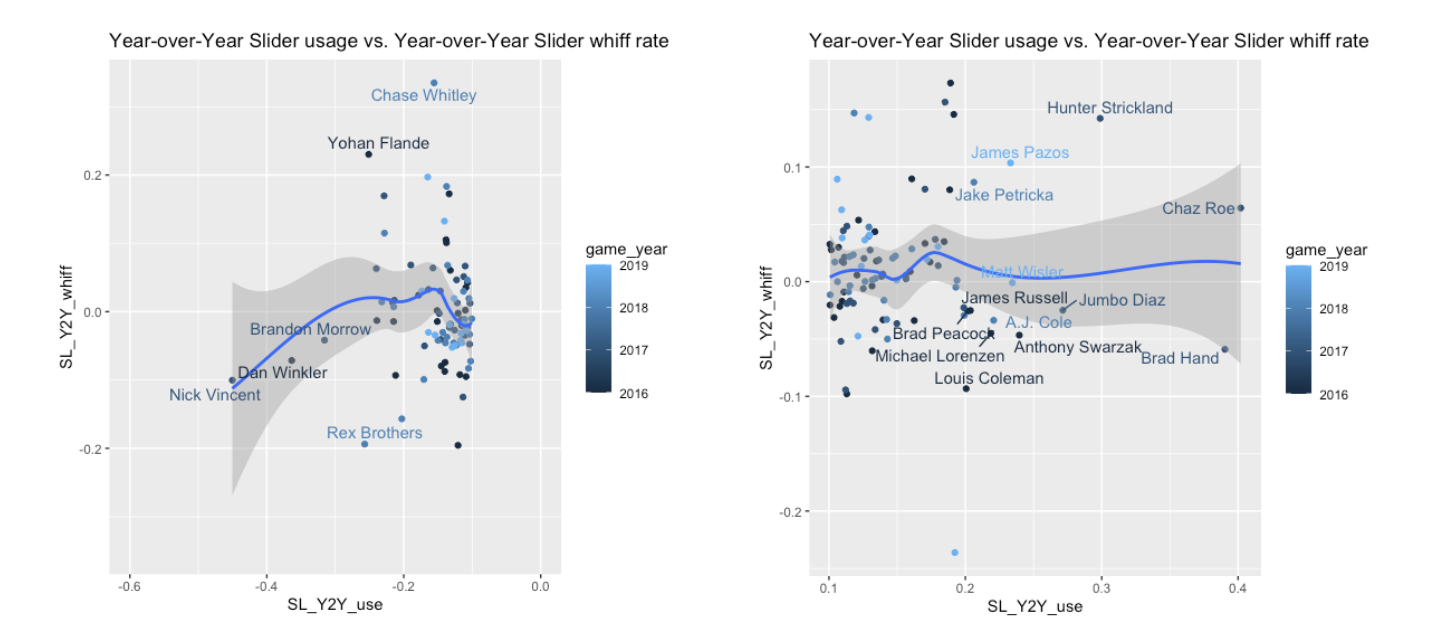 Obviously there are outliers, but it stands to reason that a high-performing pitch thrown in limited quantities will not lose its effectiveness even with a fairly large jump in usage rate. That said, what makes a good candidate for a high-use pitch, and what pitch shape is most conducive to success? To try and answer that question, I wanted to nail down which pitch characteristics contribute to the variability in year-to-year change, even though there’s no stark trend overall. Looking at the graph on the right, I wanted to know why, for example, Hunter Strickland found success and Jumbo Diaz didn’t. I conducted a Variable Importance test to try and rank average pitch characteristics by their impact on year-to-year changes in whiff rates and determine whether a particular style of Slider can best accommodate a jump in use. 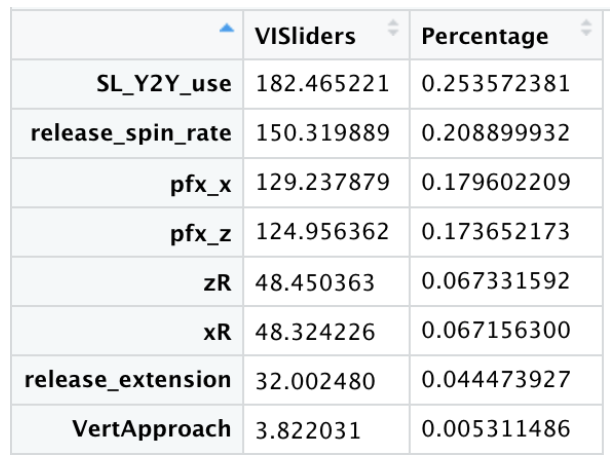 This lines up with our anecdote, as Hunter Strickland has averaged nearly 400 more RPM than Diaz on his Sliders across their careers. In the case of Sliders, there certainly seems to be more than one way to skin the proverbial cat, and no one spin or movement profile that performs best on its own. The most impactful pitch characteristic was Spin Rate, which makes intuitive sense. More spin generally means more movement, but for Sliders spin is necessary for both tight and looping pitches. To even attempt to identify a potentially devastating Slider, we first need to understand the mechanics of the pitch and how they’re thrown across the league. Traditionally, Sliders are thrown with a lot of gyro (think: football) spin that does NOT contribute to movement (the remaining, or “active”, spin is a combination of back- and sidespin). This produces a very low spin efficiency, which is just the percentage of total spin that is “active”. Low-efficiency/high-gyro Sliders create the appearance of “depth” and a pitch that doesn’t seem to move a whole lot (0-5 inches of horizontal break) but misses barrels with “late” break.  (From @PitchingNinja, ~12% Spin Efficiency) The higher spin efficiency climbs, and the more total spin contributes to movement, the more horizontal break or “sweep” a Slider will get. The relationship between spin efficiency and horizontal movement is very strong league-wide: 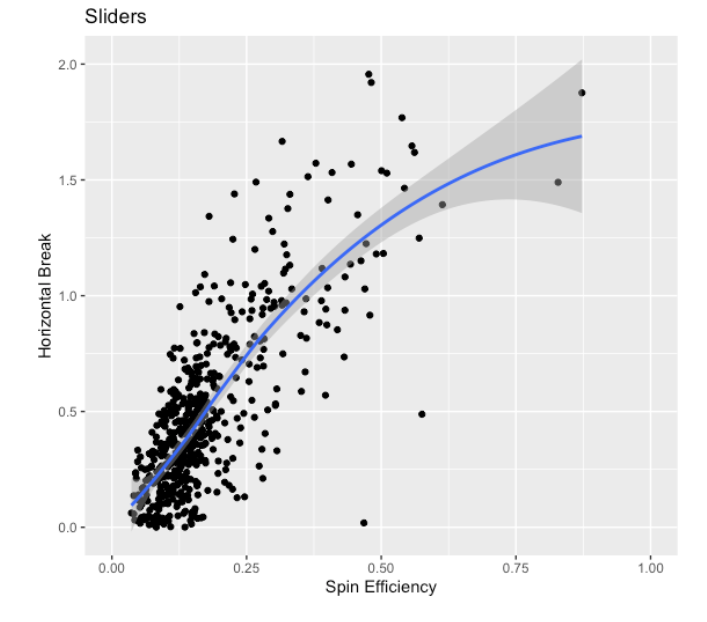 Back to our initial question, is there a “type” of Slider that performs better with higher use? There is no particular trend to usage rate along the efficiency/break curve, which led me to a potentially important realization: the success of high-use breaking pitches might be as influenced by the rest of a pitcher’s arsenal as much as the characteristics of the pitch itself, even when hitters don’t see them much. I’ve found that elite sliders are matched by pitches with nearly “opposite” spin and movement profiles, combining for a deadly arsenal. To illustrate this, I took a “Goldilocks” approach to our Slider curve, and picked a player at each extreme, and one right in the middle: 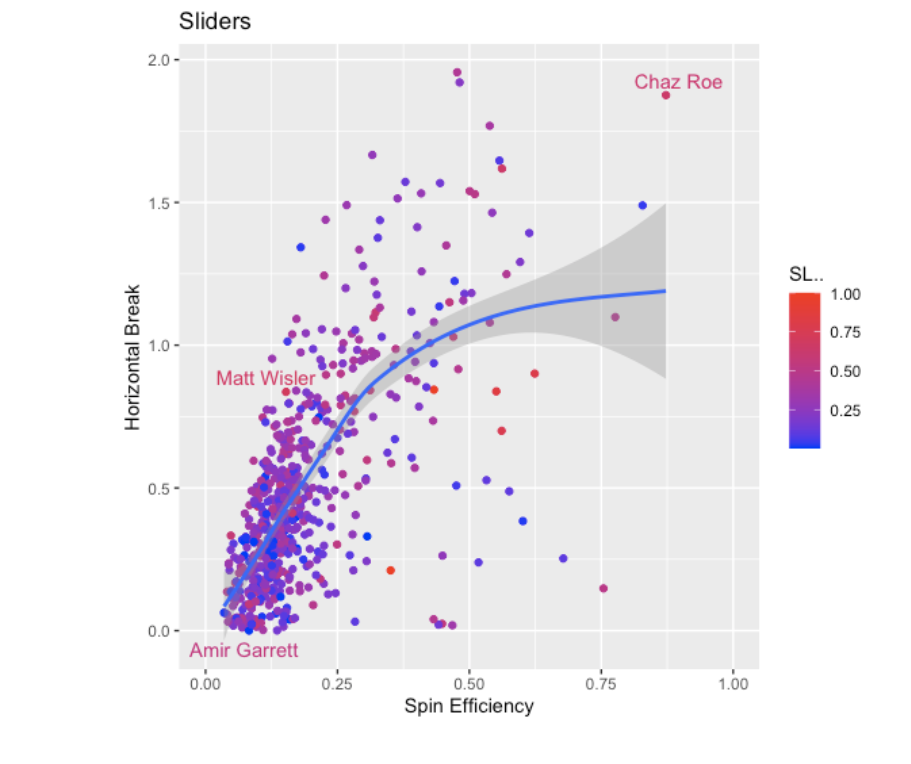 Three players, three vastly different Sliders, all thrown well over 50% of the time. So why does each work? I’ll start with PitchingNinja starlet Chaz Roe, owner of the most gif-able Slider in the league and an average horizontal break of 22.4 inches(!!). Roe’s Slider has more sweep than a broom closet, thanks to an insane career average spin efficiency of about 89% (up to 95% before his injury this year). For context, the average MLB Slider in the statcast era has a spin efficiency of about 20.6%, so it’s no surprise Roe is generating league-dominating movement. Through 159 pitches and 93 Sliders this year Roe had yet to surrender a barrel, allowing a WOBA of just .243. Roe’s Slider has almost no vertical movement, which is easy to imagine given his release:
That isn’t the only pitch of Roe’s you’ll see on your Twitter timeline, as the Sinker he throws roughly 21% of the time looks equally stupefying:  The reason I think Roe (and Wisler and Garrett) are so effective is because they generate a high degree of “spread” in their arsenals by throwing pitches with divergent spin and movement. (For an in-depth discussion of the idea of arsenal “spread” and its implications for pitch design, check out my earlier article.) Looking at each of Roe’s pitches mapped by Horizontal and Vertical Break makes this really easy to understand: 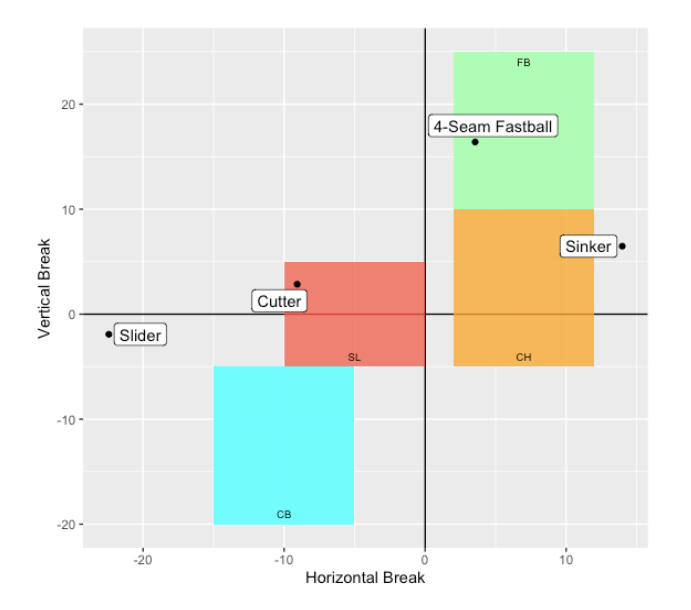 Roe’s insane sweeping Slider is really well matched by a 70% efficient Sinker with tons of armside run, keeping pretty much all of his offerings on a nearly-identical horizontal plane. This allows Roe to disguise the movement on his Slider because it looks enough like the Sinker right out of hand. That’s how he generates such ridiculous swings on a pitch the entire stadium knows is coming.  Garrett, on the other hand, throws a much tighter Slider with a spin efficiency of roughly 16%. He generates just 0.4 inches of Horizontal Break on average, but is posting an insane .180 WOBA and 66% whiff rate so far this year. While on the surface it seems to be a less impressive pitch than Roe’s it fits into Garrett’s arsenal and plays off his other pitches equally well. Rather than the horizontal-heavy approach we saw with Roe, Garrett relies on a 95 MPH 4-Seam Fastball as his secondary pitch, controlling the vertical plane with a high-spin Fastball with almost 10 inches of “ride” above his Slider. 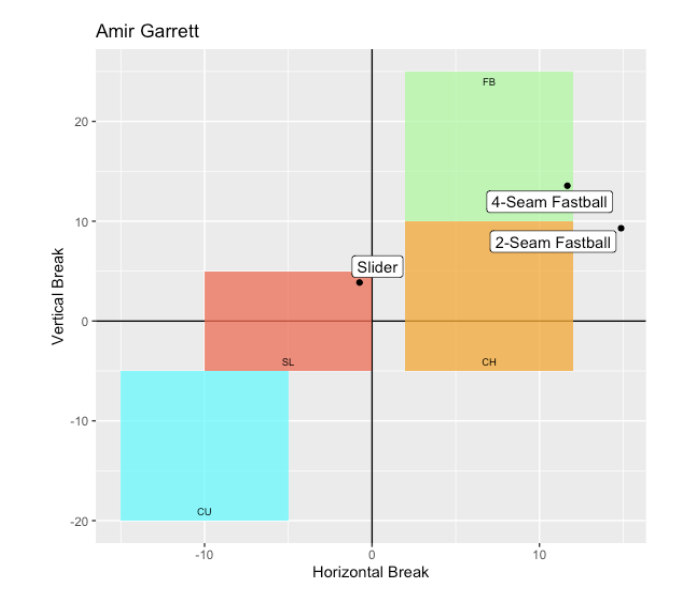 Unlike Roe, Garrett’s pitches depart on the vertical axis out of release, making for an equally devastating combination: Amir Garrett Slider 08-23-2019 GIF Amir Garrett Fastball Along with the low efficiency, Garrett doesn’t generate much spin at all on his Slider, seemingly running counter to the results of our earlier variable importance test. To me, this reinforces the need to keep pitches in context with the broader arsenal, even when a pitcher doesn’t make much use of it. That leaves us with Wisler, our Goldilocks, who is throwing his Slider a whopping 80% of the time this year yet maintaining a 38% whiff rate. Wisler falls between Garrett and Roe by Spin Efficiency at 58% this year and around 25% average for his career. Similarly, he splits the gap in movement, with an average Horizontal Break of 11.5 inches, almost exactly splitting Roe’s 22.4 and Garrett’s 0.4 inches of movement.  Wisler has the least of an “arsenal” to speak of, but plotting it on the same map gives us much the same result: 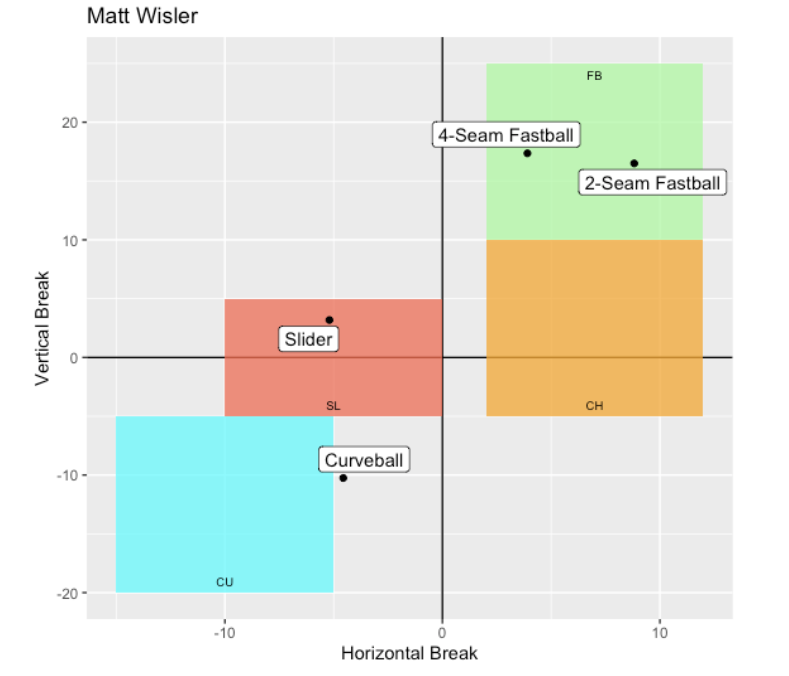 Like Garrett and Roe, Wisler maintains “spread” across his pitches and matches the moderate movement on his Slider with similarly moderate (and opposite) movement on his 4-Seam Fastball, which he throws the other 20% of the time.
Ultimately, there is no one way to throw a Slider, and no single recipe for how to make it effective at high usage rates. That said, I don’t think it’s insignificant that Wisler’s “Goldilocks” slider is having similar success at the highest usage rate, potentially signalling a reduction in dependence on the rest of your arsenal. If each guy had to throw their Slider 100% of the time, I might put my money on Wisler’s despite its subjectively less impressive movement and spin characteristics. An important takeaway in my mind is the necessity of balance in a pitcher’s arsenal, and the more extreme a pitch becomes, the more important it is to balance its movement with an “opposite” pitch to stay deceptive and effective. I think Roe’s demonic Slider becomes easier to take if it’s thrown every time, and Garrett’s tighter Slider plays up off of his heater. I’m left then with a similar conclusion I had initially -- the success of a high-use breaking pitch is as dependent on the quality of the rest of the arsenal as it is on the pitch itself -- and even the most impressive pitches need the threat of another offering to keep hitters on their toes and generate whiff after whiff, year after year.
0 Comments
By: Noah Thurm Most successful major leaguers drive the ball in the air consistently with a slight upward swing, but at the extremes this approach may bring sacrifices. Players are often discouraged from a fly-ball oriented approach in the name of contact and whiff rates, but I think plate coverage is most strongly hurt by a steeper swing. I’m most interested in how much of the zone a player can effectively control, not just throw the bathead to, so in this article I’ll use the 2D area captured by all of a player’s barreled balls as they reach the plate, or “Barrel Area,” to break this down. The next step is estimating each player’s Attack Angle, or the angle of the bat path relative to the ground through the zone (large positive values indicate steep upward swings, negative values indicate the bat impacts the ball on the way down). Attack Angle isn’t directly measured by pitch-tracking technology, but with a little intuition and some physics we can get pretty close. The bat-ball collision brings us three angles of interest, the (usually) downward angle of the pitch (Vertical Approach Angle), the (usually) upward angle of the bat (Attack Angle), and the resulting angle of the batted ball (Launch Angle) (The centerline angle will contribute to batted ball spin, but isn’t of immediate importance here). 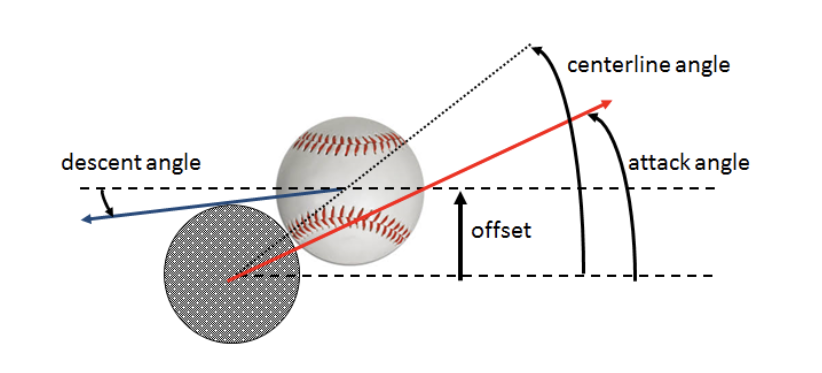 Balls that are hit the most “square” or “flush” leave the bat with launch angles closely matching the attack angle of the swing, limiting launch angle “deflection”, as I refer to it (for a more in-depth explanation and implications for pitching strategy, check out my last article). This forms the basis for our estimation of attack angle, because we can be fairly confident that a player's hardest hit balls leave the bat at about their swing’s attack angle. To come up with the final estimation, I took the peak of the launch angle distribution (i.e. the most common launch angle) for the top 20% of each Major Leaguer’s batted balls by exit velocity. As a check, we can compare the estimations of attack angle to average launch angle and see that they track together quite well, with more barrels at higher angles as we’d expect:  Charting those calculated attack angles against Barrel Area seems to answer the initial question pretty convincingly: 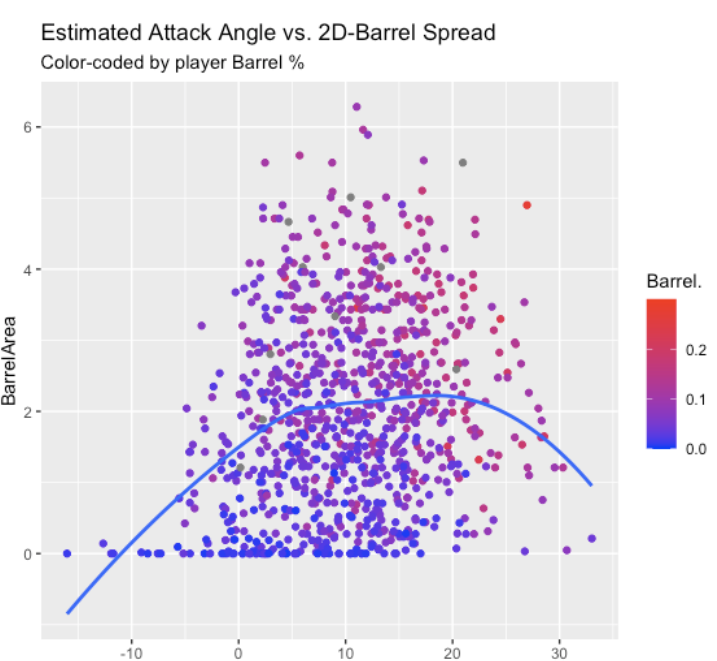 A 13° attack angle maximizes the area covered on the regression line, with attack angle extremes at each end fairly quickly compromising plate coverage. Given that most pitches enter the zone at downward angles between ~3° and ~12°, that swing path “matches plane,” giving the hitter the greatest opportunity to get the barrel to the ball. Unsurprisingly, Barrel Area is fairly strongly correlated with a player’s barrel rate (r = 0.55) and xwOBA (r = 0.52), seen below. 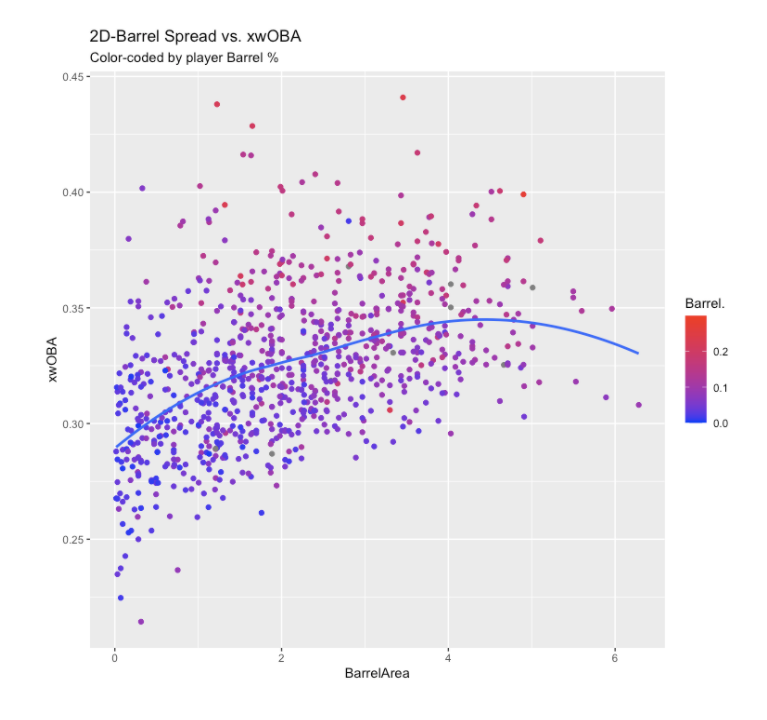 Estimating attack angle can also give us a glimpse into a player’s barrel control and barrel accuracy, as highly accurate players will minimize their average launch angle deflection, preventing mis-hits. Like barrel area, we see that an attack angle in the low teens seems to produce the most barrel accuracy: 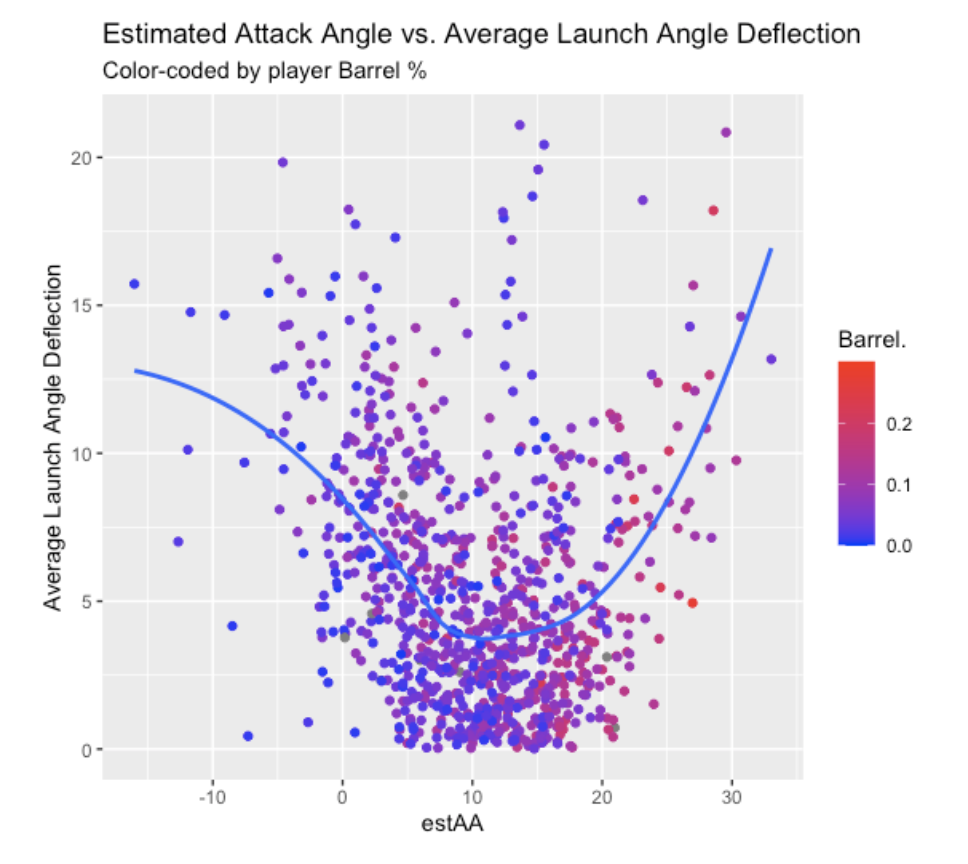 That being said, I’d caution the use of average launch angle deflection as a measure of swing control and discipline because it fails to accurately represent players who avoid mishits by just not hitting the ball at all in unpreferred locations. High whiff rates are disguised by the appearance of consistency in launch angle where a player tends to miss balls outside of their Barrel Area. To recap so far, we can be fairly confident that:
So is plate coverage a production panacea, and should hitters accordingly seek to maximize it by swinging with an attack angle in the low teens? As is so often the case, the answer isn’t quite that simple, and we can see it by looking at two seemingly opposite players, C.J. Cron and Freddy Galvis. 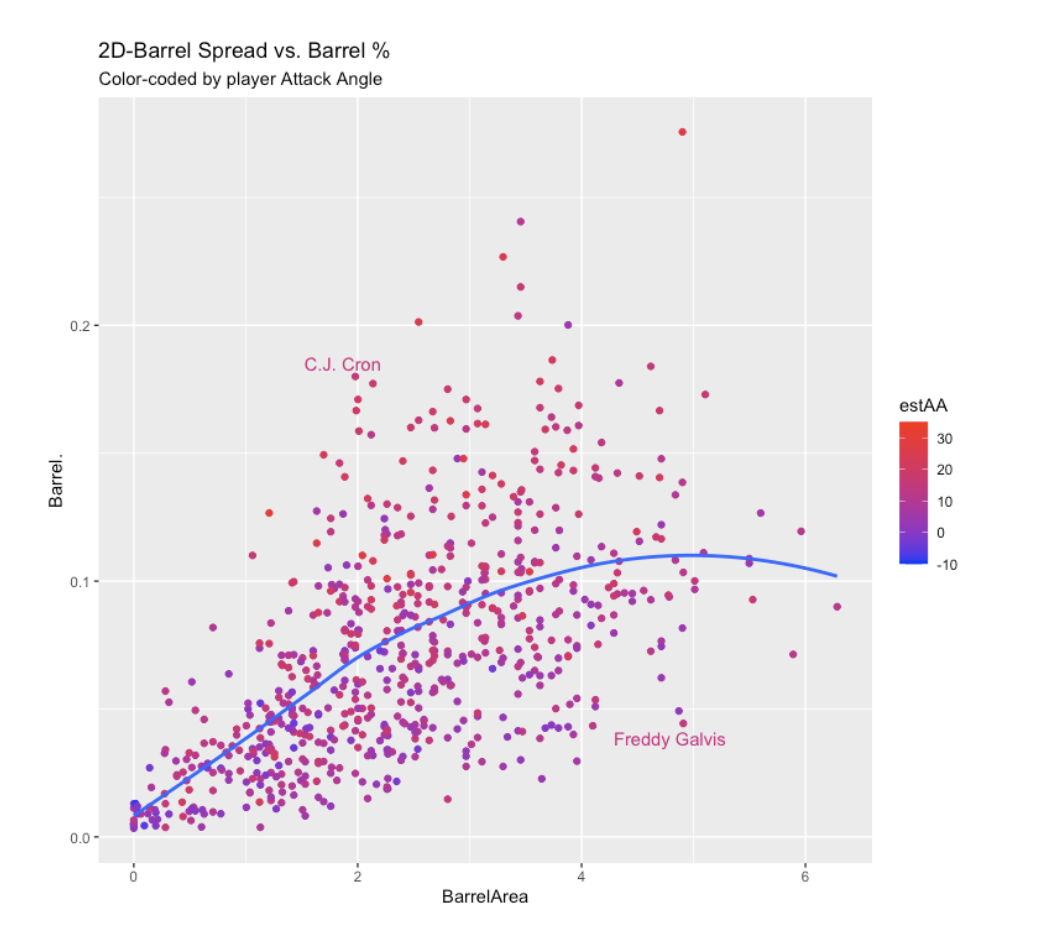 Given what we’ve just established, aren’t these guys getting it all wrong? Galvis is covering the plate but not producing (4.43% Barrel rate), and Cron dominates a much smaller wheelhouse (18.5% Barrel rate). With that coverage disparity, you’d expect Cron to have a much steeper attack: 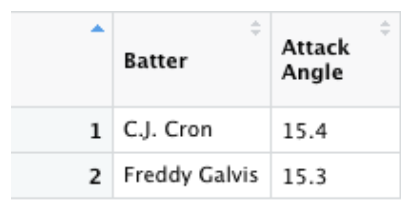 Well, Cron is a power hitter, so probably produces more barrels by hitting the ball harder: 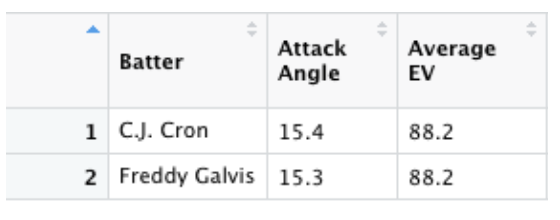 Huh. If a Barrel is driven in the air, Cron definitely hits fly balls more frequently, right? 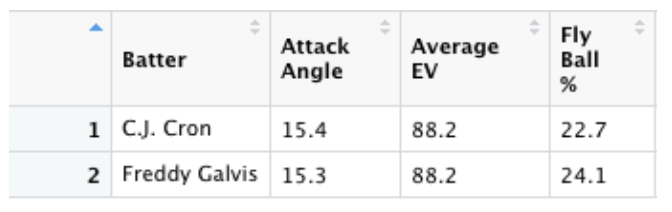 Cron and Galvis swing nearly identically, hit the ball with equal authority on average, and drive the ball in the air at roughly the same rate. So what gives? To answer, we need to go back to one of the first pieces of intuition laid out: a player's hardest hit balls leave the bat at about their swing’s attack angle The flip side of this is that any ball not hit at around the attack angle loses some exit velocity on account of that “deflection” and the reduction in contact quality. Taking a random sample of 5% of the batted balls in the Statcast era (~30,000 events) makes this point quite clearly. 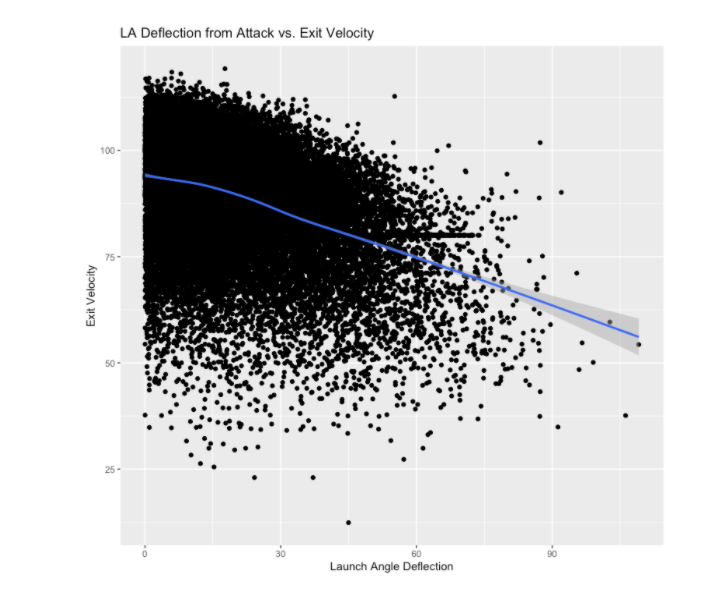 The more a ball is deflected away from a player’s attack angle, the more velocity they will lose, and maximal exit velocities are clustered around a deflection of 0°. Taking that into account, the gap in barrel rate between Cron and Galvis begins to make sense, particularly once we add Max EV to the equation. 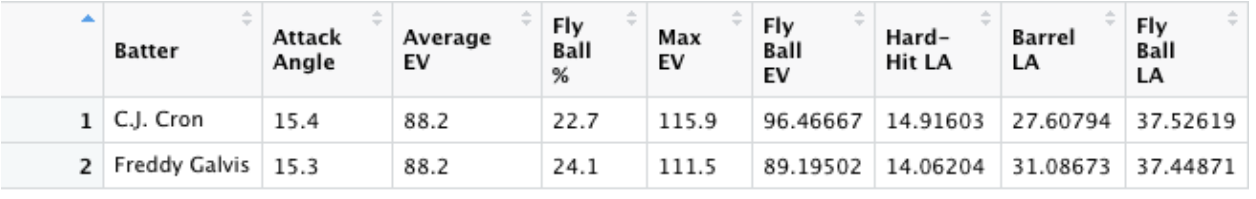 Neither Cron nor Galvis has a very steep swing, so both players will need to go through quite a bit of deflection to produce a Barrel (defined by Statcast here). The problem for Galvis, then, is that he hits his fly balls at an average of 22° away from his attack angle! Using our modeled relationship between deflection and exit velocity, that produces a loss of more than 9 MPH off his maximum exit velocity. That effectively limits him to a maximum possible Fly Ball exit velocity of just 102 MPH, good for 280th in the MLB last year. It’s no surprise, then, that his average hovers around 89 MPH on fly balls, producing a hit probability of just .027! Average exit velocity is not terribly predictive, but in this case tells us the quality of contact Galvis can expect more regularly when deflecting the ball into the air. Starting with a lower Max EV, he simply cannot afford the decrease in exit velocity required to put the ball in the air swinging as he does. Cron, on the other hand, hits the ball harder, which means he has more exit velocity to “lose” as his launch angle increases, producing way more Barrels. He has more behind his fly balls, and with the swing discipline to stay in his (albeit smaller) wheelhouse, he is a more efficient and effective power producer with a nearly identical swing and batted ball profile. 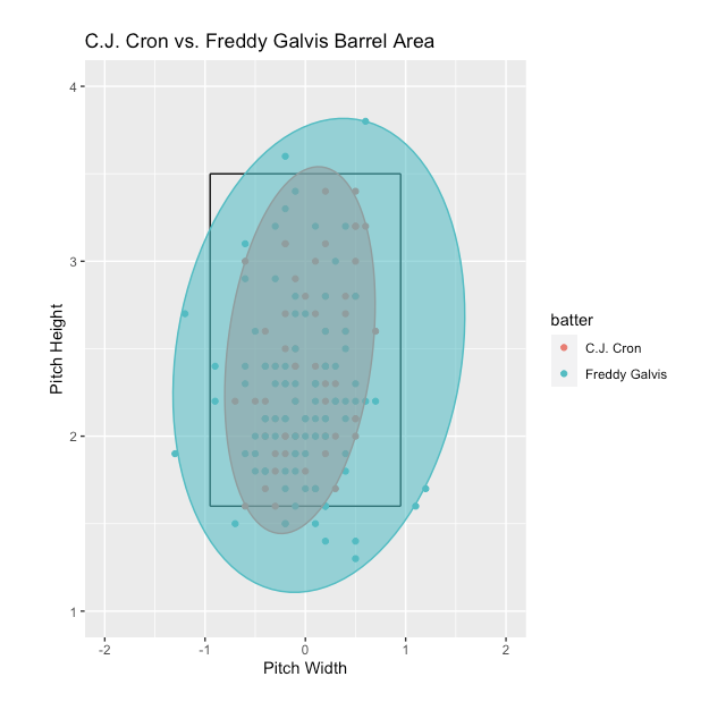 Being able to control the zone is helpful, but if expanding the “wheelhouse” compromises contact quality and creates more mishits, that coverage will not translate to production. Galvis has an above average barrel spread, but the vertical and horizontal deflection that more swing-happy approach generates hurts his ability to punish those pitches. If you cannot hit a pitch hard consistently, swinging at it is unlikely to do you much good. Ranking the variables we’ve discussed so far by their correlation with Barrel rate shows us this: 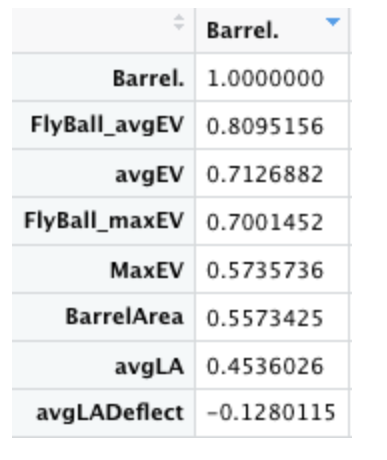 We know we must hit Barrels to produce at a high level, so hitters need to prioritize how hard they’re hitting their fly balls. If you can get the barrel to any pitch chalk to chalk but can’t drive them in the air with much authority, you’re facing an uphill battle to be successful. This is an important realization that could nuance the way we think about swing path. In my experience, we tend to want to reserve steep swings for powerful hitters who can “afford” to hit the ball at higher angles because they have the exit velocity to turn those fly balls into homers and extra base hits. What Galvis’ production screams to me, however, is that it's guys without superhuman strength who could benefit the most from trying to induce a little more loft with a steeper swing. It is nonnegotiable that balls must be hit hard and in the air to maximize production, but a flat swinger cannot do that without compromising exit velocity.  (Exit velocity to spare, Exhibit A. Attack Angle: 12°)
Hitters without exit velocity to spare would be best served by training attack angles that preserve exit velocity on fly balls by matching the desired launch angle. Put simply, if you want your hardest hit balls launched between 18° and 30° (where the most valuable batted balls are hit), you should think about swinging nearer to that range -- plate coverage be damned. By: Noah Thurm Successful pitchers limit damage by minimizing the quality of contact they allow. How they can best do that remains up for debate, with pitchers focusing on some combination of deception, movement, and location to try and miss barrels. I propose that the most important pitcher-influenced variable to quality of contact is Launch Angle, and understanding and influencing it ought to be a near-top priority for all pitchers. It is clear that Exit Velocity is the single most important predictor of a batter’s success, but that relationship cannot be manipulated much, if at all, by any pitcher. Across Major League Baseball, batters’ Exit Velocity distributions are much tighter than their Launch Angle distributions. This means pitchers are likely better able to directly influence Launch Angle than Exit Velocity, which is quite “sticky” around the mean for a given hitter. No amount of talent on the mound can rob Giancarlo Stanton of the strength that produces 120+ mph homers, but that doesn’t mean his production cannot be neutralized. Alex Chamberlain of RotoGraphs recently explored this idea at great length, coming to much the same conclusion. This, to me, demands a new pitching approach centered around what I call “Launch Angle Deflection,” or the attempt to induce weak contact and get outs by “deflecting” batted balls to extreme (and therefore suboptimal) launch angles. A recent thread by Tom Tango (@tangotiger) illustrates this quite well, where each line represents an 8-degree “group” of launch angles. At either end of the launch angle spectrum, batted balls closer to the edge produce lower wOBA at all Exit Velocities. 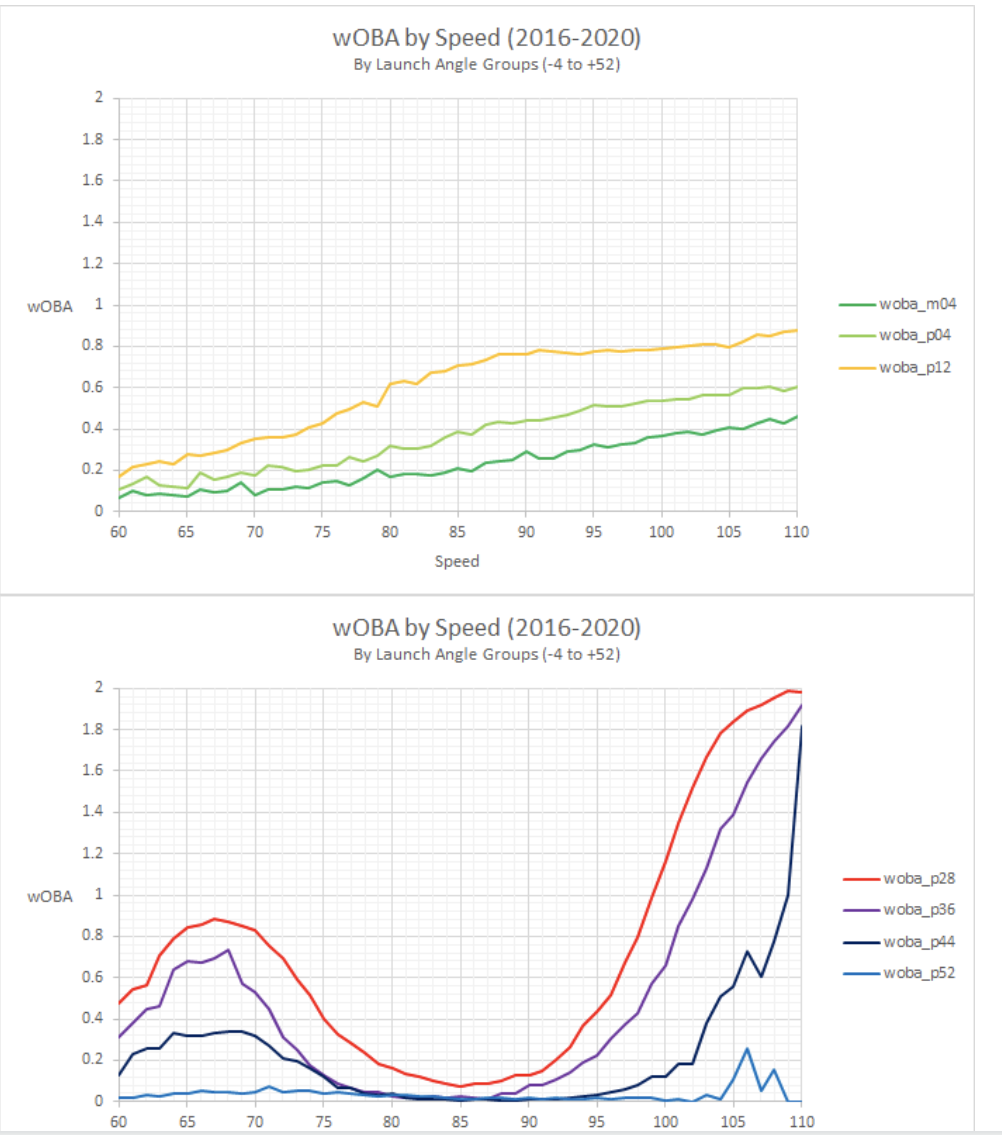 https://twitter.com/tangotiger/status/1291001207633448961?s=20 To quickly recap:
If influencing Launch Angle is the key to limiting damage and getting outs, how can a pitcher do so? To answer that, I ran a series of Variable Importance tests on a number of different pitching metrics to determine which have the greatest impact on Launch Angle. Analyzing every batted ball in the Statcast Era through 2019, the results were clear: the most significant variable to Launch Angle across pitch types and irrespective of pitcher handedness was pitch height. The results from RHPs’ Four-Seam Fastballs exemplify this, and the rest can be found at the link below. The top four variables by importance are all related to the height of the pitch and eat up the vast majority of the statistical significance to launch angle. 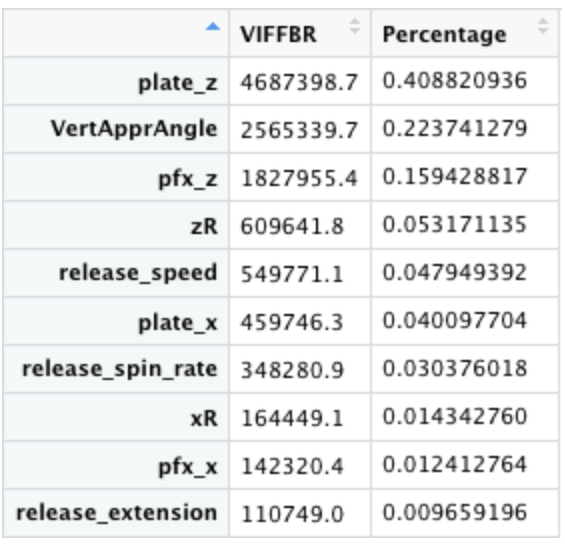 Represented graphically, we can see that pitches of all types up in the zone tend to produce higher launch angles, while most ground balls occur on low pitches. 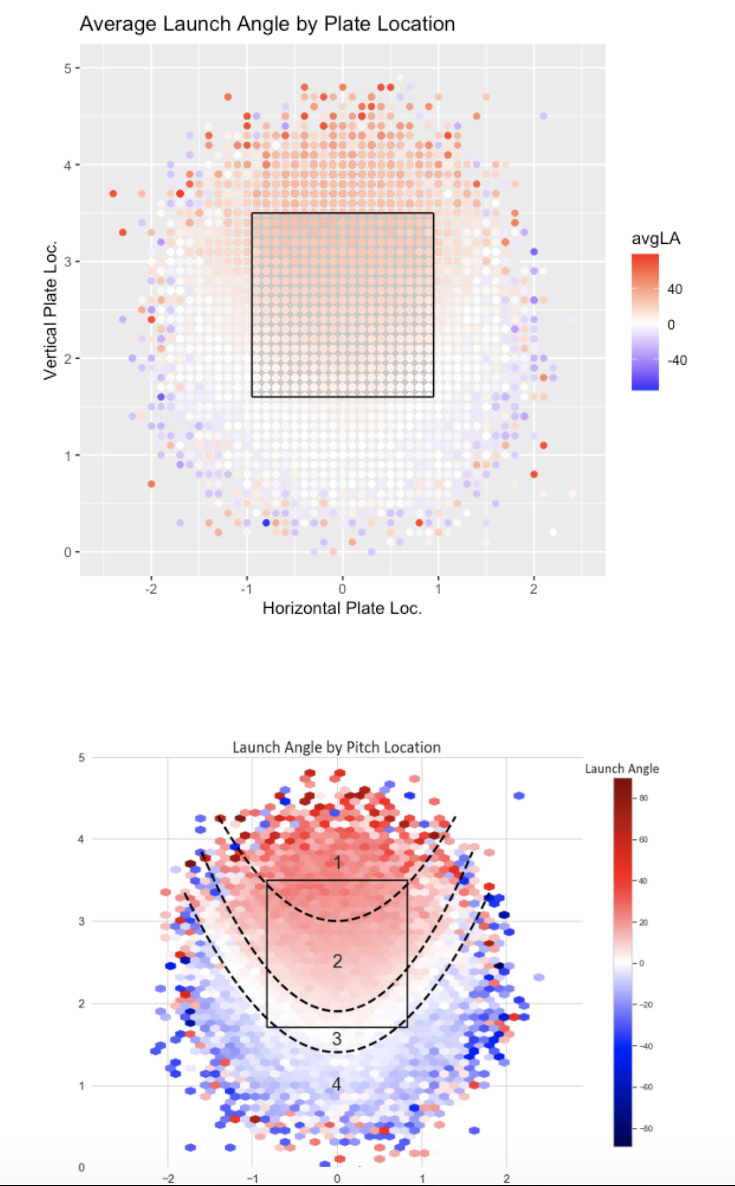 This visual above from Connor Kurcon groups launch angles into curved bands Putting it all together, the suggested pitching strategy is to push hitters to the nearest extreme of Launch Angle given their average. This could look radically different depending on the hitter, which I’ll explain using two players with similar exit velocities on quite opposite ends of Launch Angle: Joey Gallo and Eric Hosmer. 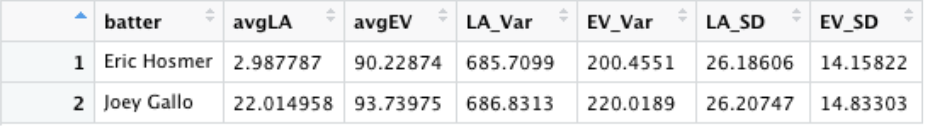 Looking at each player’s batted ball distributions is helpful as well: 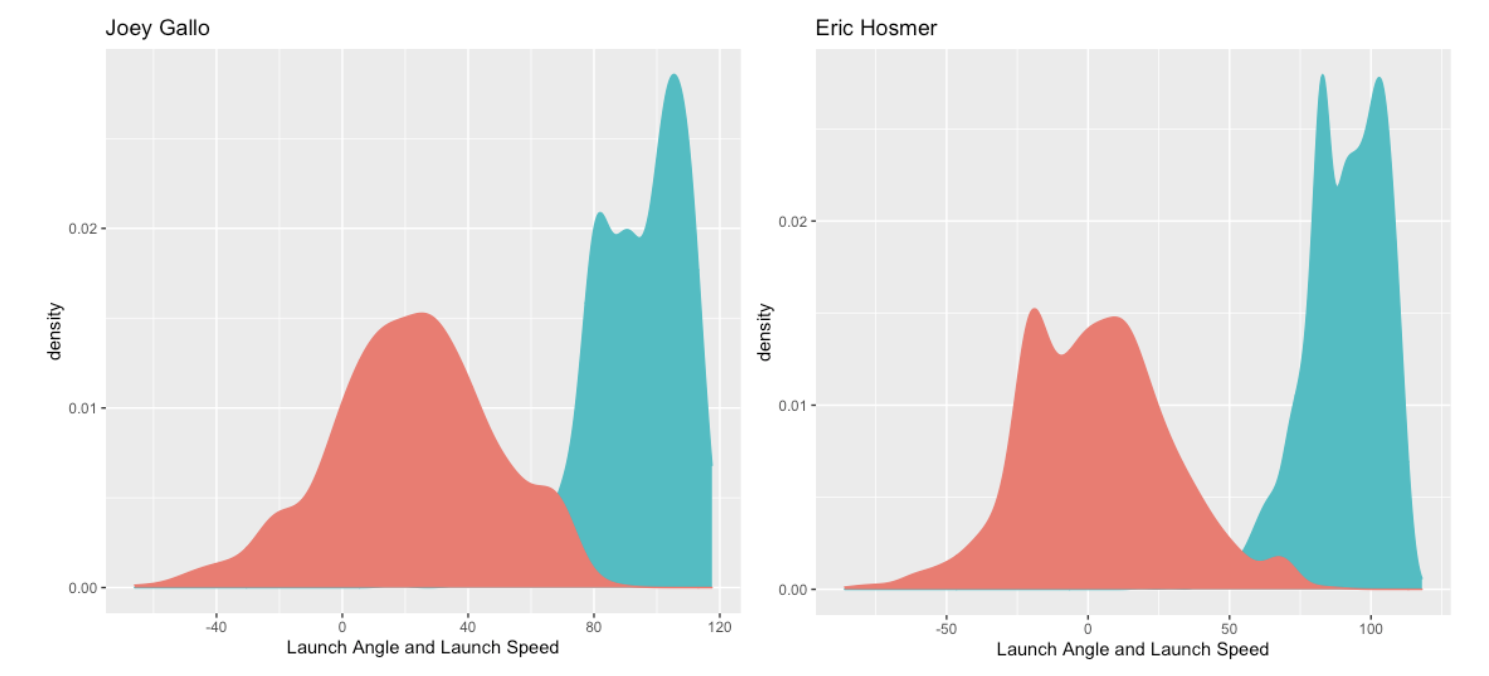 The two have EV distributions that look quite similar (in blue), but Hosmer’s launch angles are centered much lower than Gallo’s. This means we need different approaches to pitch to each player. Starting with Gallo, that 22° average LA puts us much closer to extremes on the high end of LA, suggesting primarily pitching up in the zone. This may seem counterintuitive for a guy with Gallo’s home run pop, but trying to keep him “in the park” by inducing ground balls forces a pitcher to try and pull him through the most dangerous launch angles in the middle to get to comparatively harmless single-digit and negative LAs. Looking at his xBA by Launch Angle and pitch height makes this easier to understand: 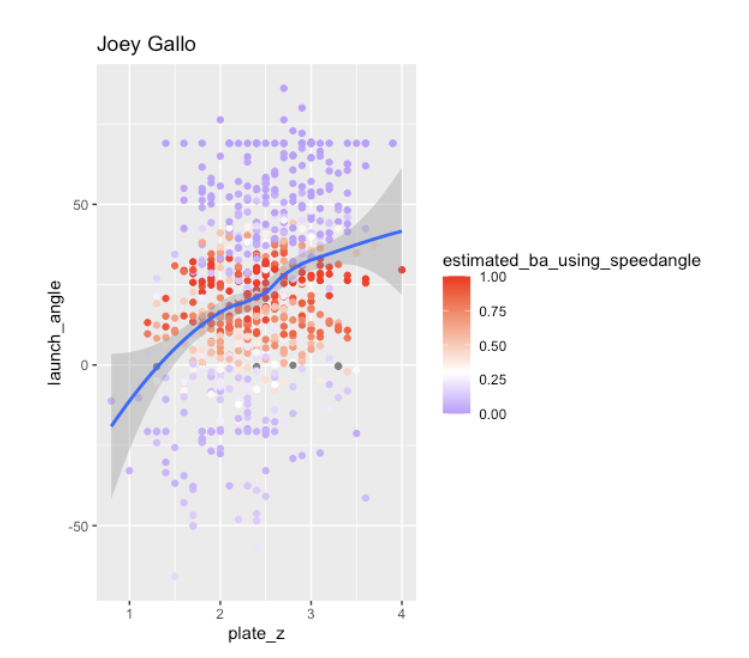 The place where low-damage batted balls lie closest to the trend line between plate height and launch angle is at pitch heights above ~2.75. Pitches there don’t require a mishit or uncharacteristic outcome to get outs, they generate launch angles that neutralize his power. Trying to get Gallo on the ground by pounding the bottom of the zone leaves far less room for error, as there are plenty of high xBA balls below the trend line. Hosmer, on the other hand, is far more susceptible to that same low-ball strategy because his nearest extreme of Launch Angle is the negative range where ground balls (i.e. outs) occur. Looking at the same chart for Hosmer confirms this: 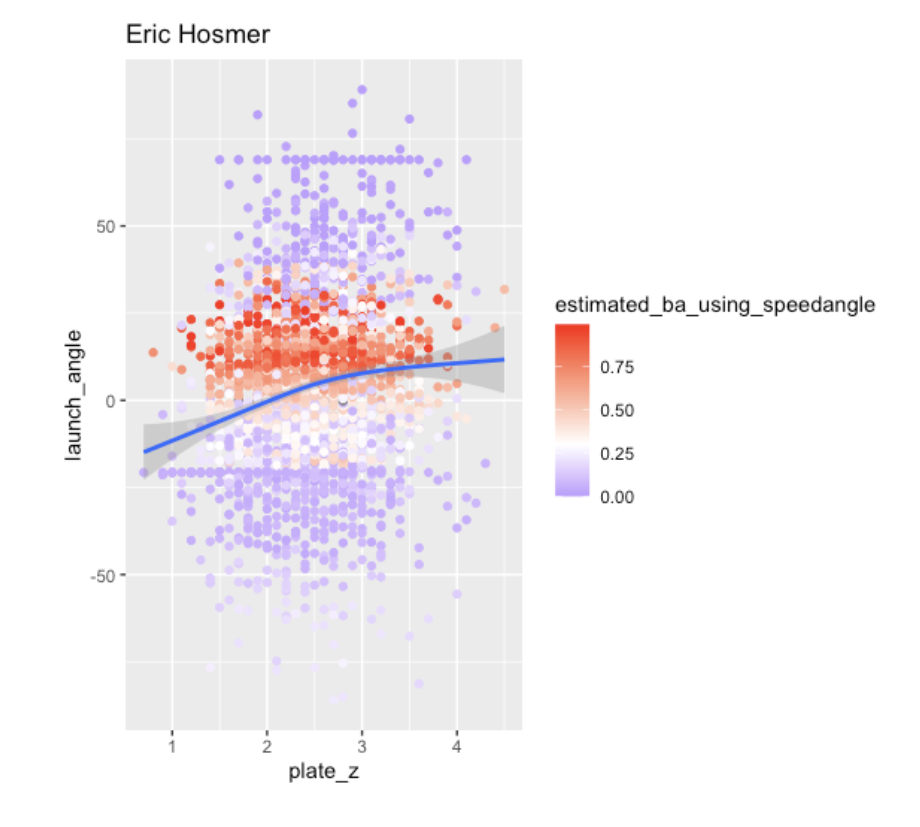 Hosmer’s average LA is so low that pitchers should stay out of the top of the zone where he is more likely to elevate and succeed beyond his average. Hosmer’s batted balls with the highest xBA are concentrated above the trend line, meaning like Gallo, pitchers should lean into his tendencies and go the other way, relying on pitches breaking and finishing down in the zone to produce contact that will not hurt them. Deciding which players should be pitched in each direction is a challenge all its own, and the “break point” will shift based on a pitcher’s and staff’s priorities. If the goal is to limit the damage done by an average batted ball, I’d posit a “break point” around a 20° average Launch Angle. Given a game situation where a pitcher is more interested in limiting the damage of an especially hard-hit ball, the threshold for attacking up in the zone ought to be higher. At EVs above 100MPH, xWOBA increases with every degree of launch angle between 8 and 32. In trying to mitigate this worst-case scenario, a pitcher may be more comfortable trying to push a batted ball from 20° to a less dangerous 8° than to 32° by going through 12° of more dangerous territory. With a final assist from Tom, we can see this xWOBA variability in the middle ranges of LA: 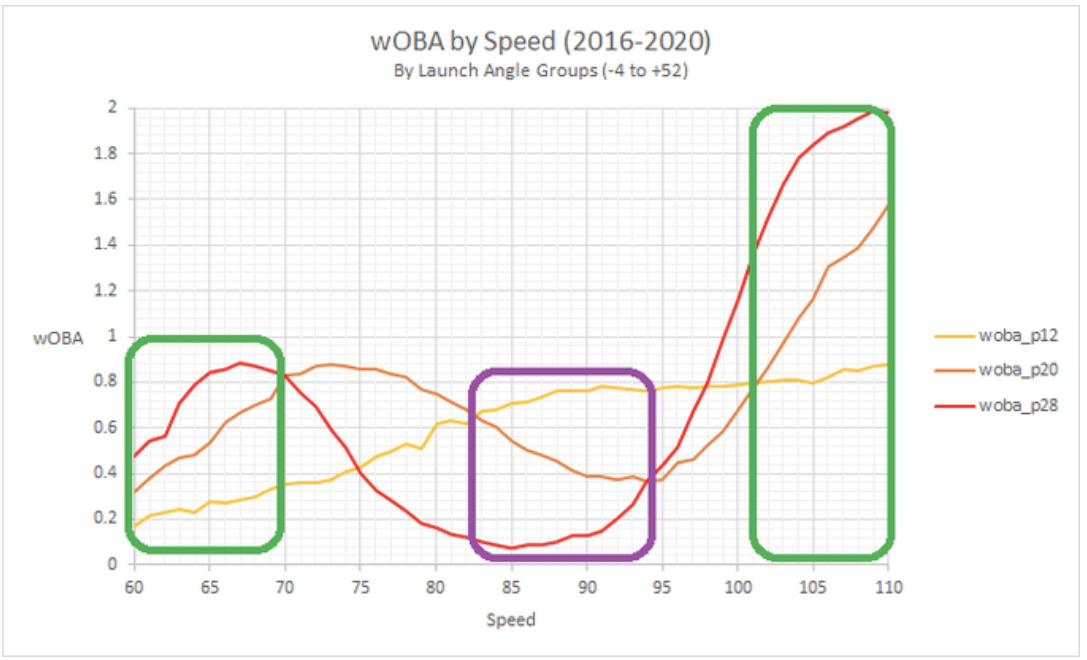 This is why we’ve seen a huge wave of successful high-efficiency fastballs pounded up in the zone from pitchers like Justin Verlander, Gerrit Cole, and Lance Lynn. At exceptionally high EVs they risk giving up home runs, but the tremendous whiff rates and weak air outs they generate are hugely beneficial. In practice, I think these findings suggest teams move away from a “heatmap” approach to attacking hitters by throwing to colder EV spots. Exit Velocity is far more resilient than Launch Angle to location and pitch execution and Launch Angle provides a clearer path to limiting the quality of contact -- and ultimately runs -- a pitcher allows. Outs don’t all need to be weakly hit, and with a smarter, vertically-oriented approach, pitchers can get more outs at any Exit Velocity. 1 Curveballs and Sinkers returned vertical break in the top spot, which is the physical means to the end of pitch height, and not a significant exception in my mind.
2 Full test results available at: https://rpubs.com/njt17/647088 3 @ckurcon on Twitter : https://twitter.com/ckurcon/status/1285629595337789441?s=20 |
AuthorWrite something about yourself. No need to be fancy, just an overview. Archives
August 2020
Categories |

 RSS Feed
