
|
It’s well understood that a repeatable delivery helps a pitcher. It may contribute to deception by disguising pitches longer as well as arm health and longevity by avoiding new and unexpected stress on the arm. In modern baseball parlance, “tunneling” is as widespread and desired an attribute as any other, and one look at a PitchingNinja overlay makes it clear why. Elite pitchers excel at repeating their release point and the first few feet of ball flight, and new tools like Driveline Edge allow for measurement and testing in pitch design for all players. While there’s little debate about the benefits of consistency, considerably less has been done in regards to the precise pitch result and swing outcome effects of greater release repeatability and “tunneling.” Knowing more about the expected improvement in outcome from a change in a pitcher’s release pattern gives us a better guide to contextualizing release point data across outings and see how it translates to in-game performance. In trying to develop a useful comparison, the outcome reference point I first settled on was swing rate -- with the intuition being that the better a pitcher “tunnels,” and the more consistent they are at release, the higher the swing rate on their primary offspeed pitch would be. Using data from the 2020 season, my initial results did not conform to that hypothesis. Charting swing rate against the pythagorean difference in release point compared to each pitcher’s fastball {Sqrt[(HeightFastball - HeightOffspeed)2 + (Horiz. PositionFastball - Horiz. PositionOffspeed)2]} returned a surprisingly inconclusive result. 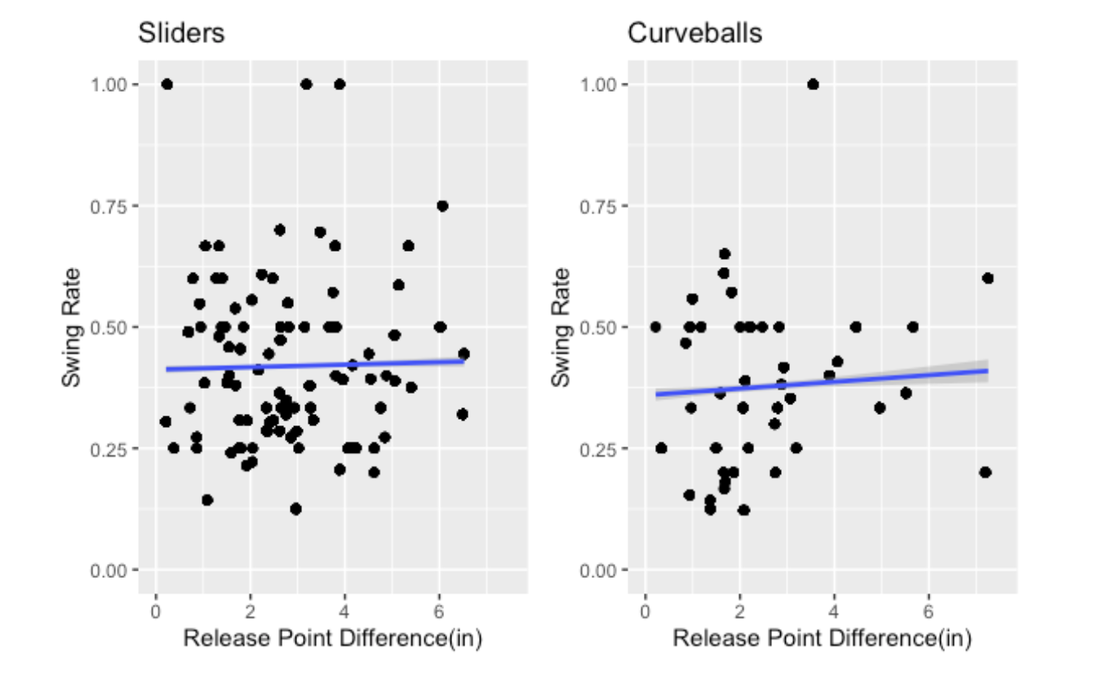 There was no compelling relationship visible in the data, and tests of the bivariate pearson correlations confirmed this, with Sliders having r = .079 and Curveballs coming in at just r = .110. This seemingly flew in the face of the conventional wisdom, and the relationships were no stronger when testing against swing and miss or chase rate alternatively. The anecdotal and experiential evidence in favor of a more repeatable release having an appreciable positive relationship with swing outcomes is strong enough that it warranted further investigation, and resolving deviation from average Fastball release position into its vertical and horizontal components significantly changed the tests’ results. Once release height and horizontal position (“Release Side” per Trackman) were isolated and tested independently the data began to confirm my suppositions and general intuition. 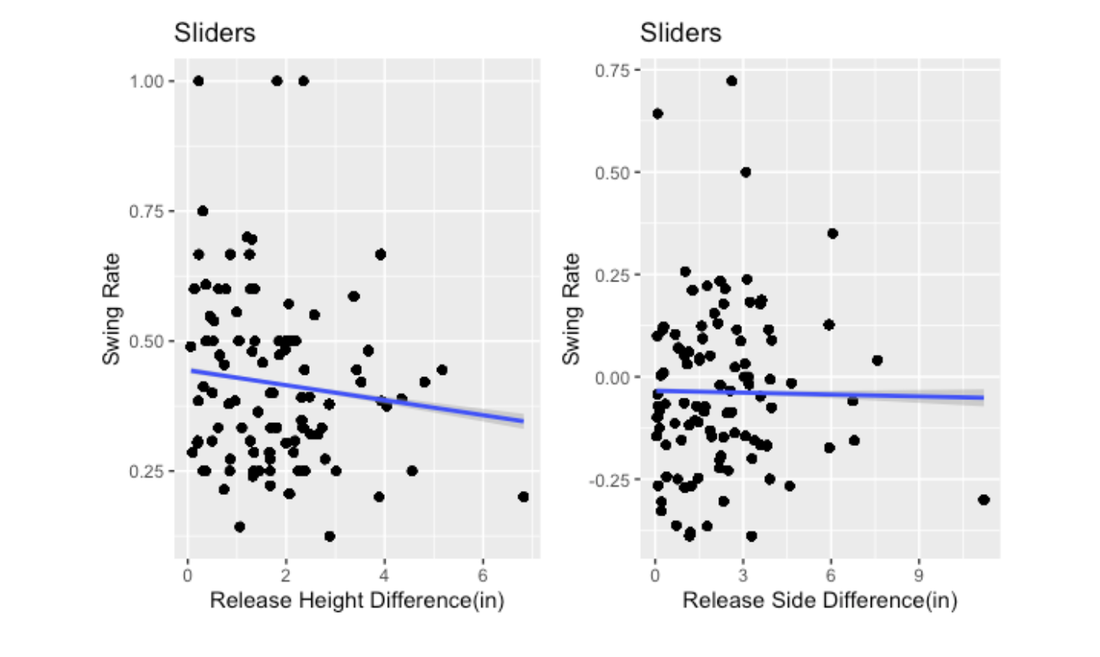 Starting with Sliders, splitting height and side revealed that release side has little appreciable effect but release height does have the expected relationship with swing rate. Compared to the combined r value of just .079, release height returned r = -.295 with swing rate. Applying the same process to Curveballs produced an even more impressive outcome: 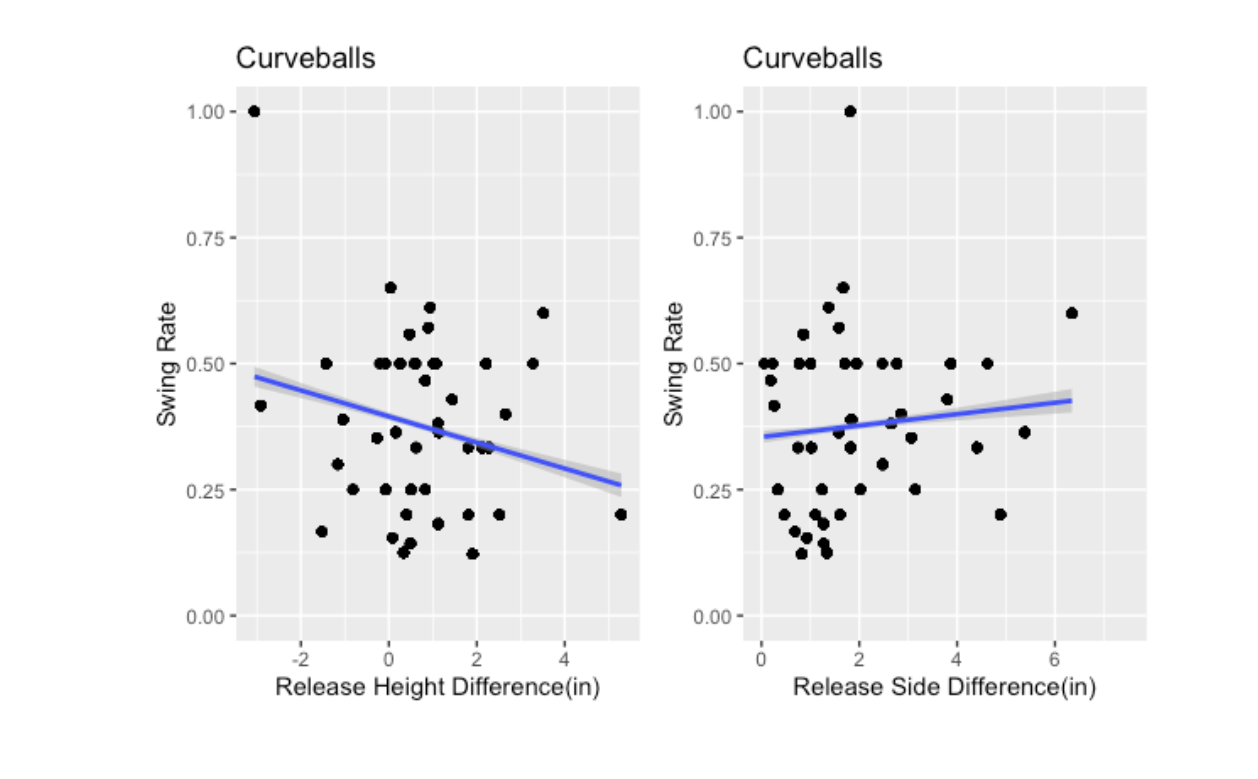 The plot shows an even stronger swing rate dependence on release height, with r = -.327 compared to a relatively inconclusive positive relationship with release side. This exaggeration in result for Curveballs was not surprising, given their relative ease of identification compared to most sliders. The tendency of a curveball to “pop” up out of the pitcher’s hand aggravates the effects of a difference in release point and trajectory, placing a greater emphasis on releasing a curveball at the same height as a pitchers’ fastball. Having a different release point as well as a different look out of hand predictably fails to fool a hitter, minimizing the effectiveness of the Curveball. That said, those unique Curveball release characteristics can have other benefits for a pitcher, particularly so in regards to producing looking strikes. The benefits of release consistency seem to be turned on their head when looking at strikes taken, with height and side deviations contributing to more looking strikes: 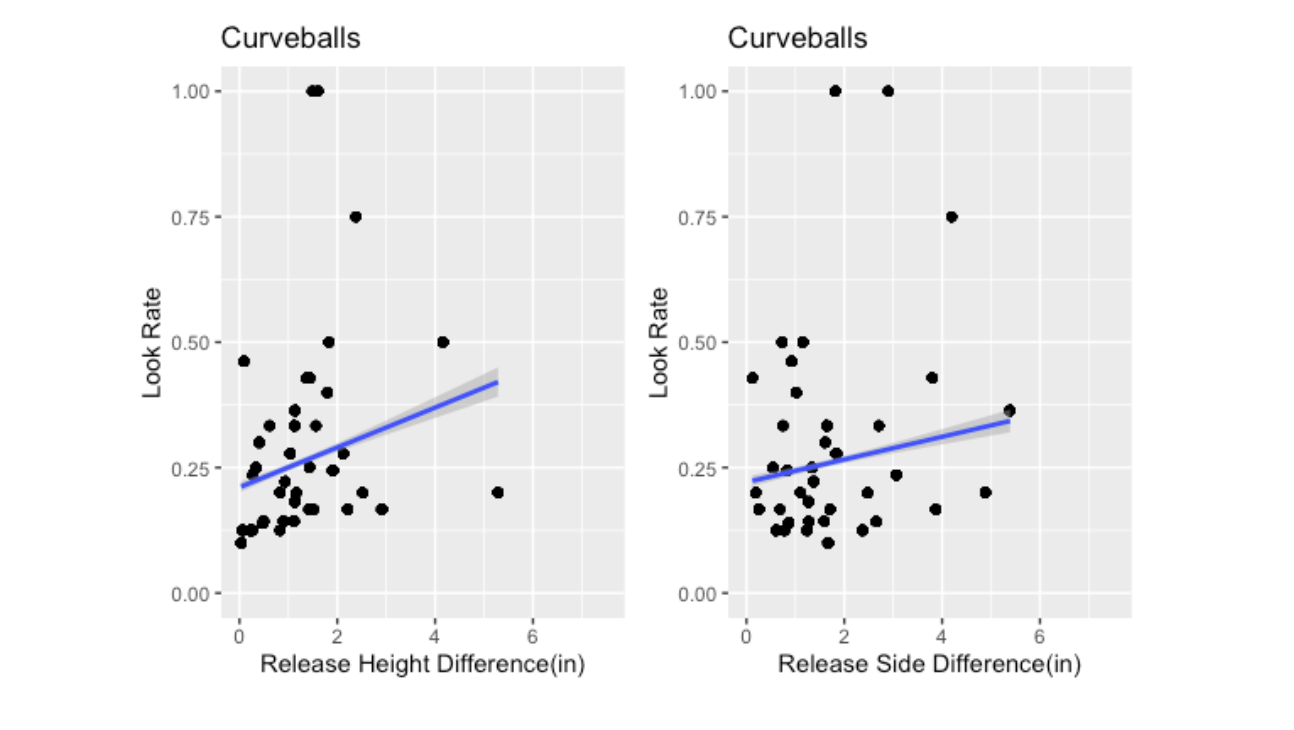 This is certainly something to keep in mind for pitch design, as a sufficiently different “look” to an offspeed pitch may surprise or freeze a hitter and steal some strikes. In assembling an arsenal, it may be beneficial to have the best of both with a well-disguised Slider and a change-of-pace Curveball as weapons.
All that said, both the data and statistical relationships were fairly constrained, leaving wide confidence intervals and necessitating some deeper analysis. I would expect the relationships between pitch consistency and swing outcomes to be strengthened by looking at the first few feet of flight rather than just release, allowing for elite “tunnelers” to separate themselves from the pack and produce a more convincing statistical result. Moving forward, it appears that release height is king when it comes to deception, allowing some wiggle room in horizontal release position to accommodate a player’s habits and feel. Despite the temptation to do so, it may not be beneficial to try and eliminate a pitcher’s tendency to change slot or arm angle on their offspeed pitches as long as height is well matched to their fastball.
0 Comments
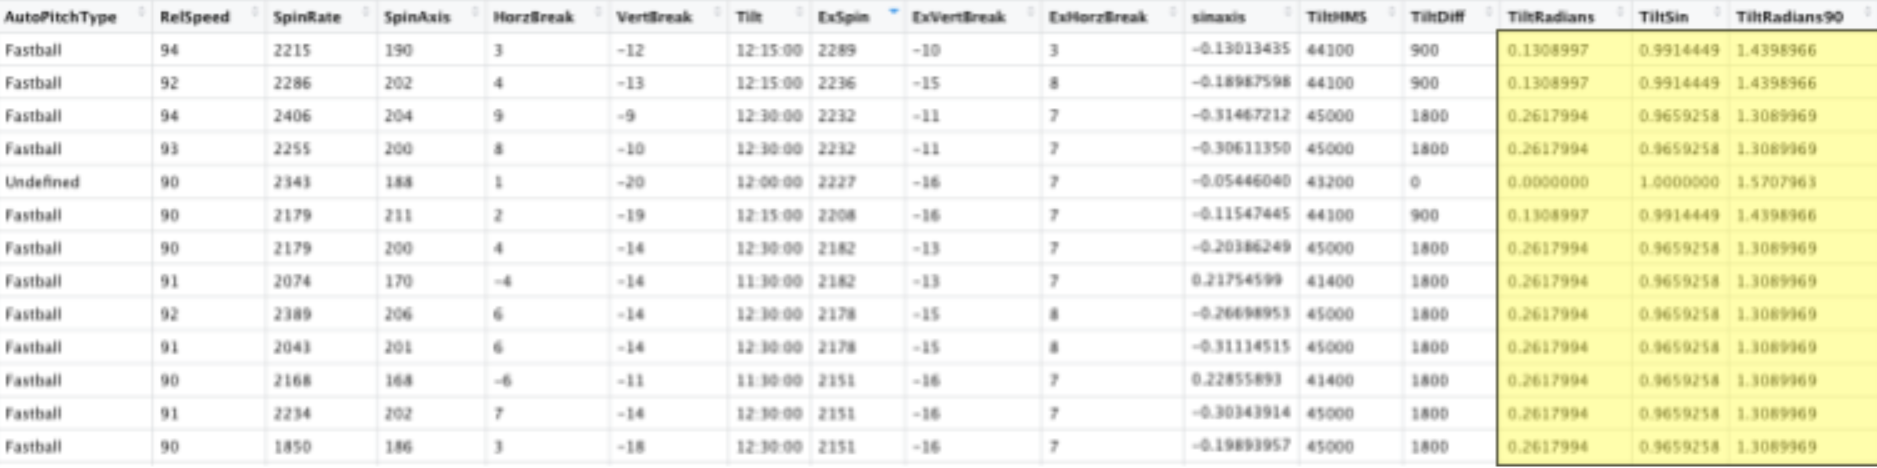 By Noah Thurm In throwing a fastball, all spin is not created equal. Although it is well understood that higher spin fastballs induce more swings and misses, fly balls, and weak contact than a low-spin fastball of the same velocity, that simple analysis has two crucial shortcomings from a player development perspective. First, spin is as close to an inherent characteristic as there exists in pitchers, making it exceptionally difficult to train. As much as we might like to be able to skyrocket a pitcher’s spin rate, short of employing foreign substances there isn’t much to be done. It will improve with added velocity, but the ratio between a pitcher’s velocity and spin is all but fixed. Second, the benefits enjoyed by high-spin pitchers on their fastballs depend not just on how well a player spins the ball but on how much of their raw spin is converted to vertical movement. Spin resists the downward pull of gravity by generating lift via the Magnus Force, giving high-spin fastballs the illusion of “rising” as they reach the zone. However, only the spin that is around a horizontal axis, called transverse spin, contributes to backspin and lift. So, where does this leave us? While we may not be able to do much about a given pitcher’s spin rate, if we can understand how much movement he is getting, and more importantly, how much he should be getting we can develop a novel training and pitch design plan. The dilemma we are left with then is this: who gets the most out of their fastballs and who can improve. To help with this, we developed a new composite metric based on prior research by Driveline Baseball called “Pitch Potential Percentage.” Drawing on over 200 pitchers’ worth of data from the 2020 season, we built a model for predicting the spin rate and vertical movement of an average pitcher’s fastball given a velocity and release characteristics. To nail down a prediction for vertical movement, we find an expected transverse spin rate. By taking averages at each velocity and multiplying by the sin of the tilt in radians we can isolate the vertical component of the pitch vector and hone in on vertical break. Having an “expected” spin rate and vertical movement lets us compare our pitchers’ metrics to an average D1 pitch and see who has the potential for growth. Particularly, we were interested in players who are not getting the most from their spin, and therefore don’t have as effective a fastball as they could. That’s where Pitch Potential Percentage, the difference in percentile rank for a pitcher’s spin rate and vertical movement compared to the model’s prediction at their fastball velocity, comes in. The players with the highest Percentages are guys whose spin performs significantly better against the model than their movement, tipping us off that with some tweaks to wrist, hand, and finger position at release we can alter the pitch’s axis and movement profile. 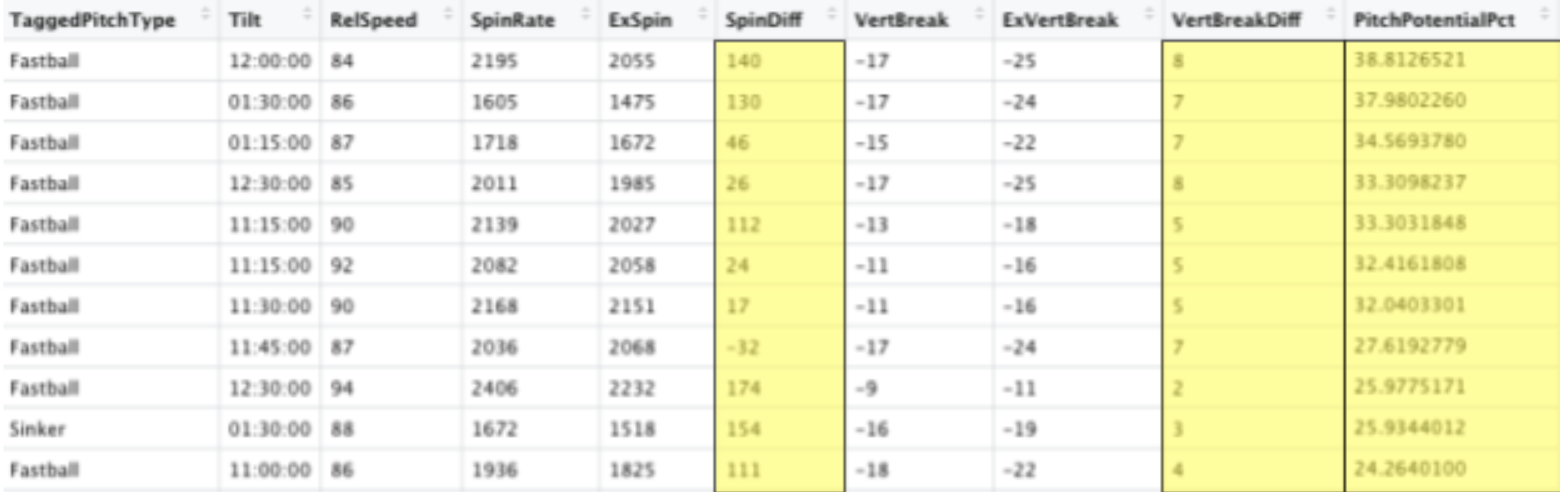 Pitch Potential Percentage isn’t a silver bullet though, as there are certain pitchers who may not want to maximize vertical movement. Sinkerballers, for instance, throw with very little transverse spin and might be hurt by adding an extra inch of lift to their fastball, and cutter-dominant pitchers may thrive by generating gyro spin and horizontal movement.  For the pitcher who is throwing a true four-seamer and is looking for an extra edge, Pitch Potential Percentage may tell us how we can squeeze out every bit of performance possible today. Moving forward, we’ll look to track progress towards a potential of 0, and see how similar methodologies can be applied to breaking and offspeed pitches.
|
AuthorWrite something about yourself. No need to be fancy, just an overview. Archives
August 2020
Categories |
 RSS Feed
