
|
By: Noah Thurm Our main goal of the coaching staff and analytics group is to create the most practical and applicable use of data, so the players can quickly and readily use the data provided. We continually search for ways to translate data into results. This is just another great instrument developed here that quickly helps players get better results. From the coaching side the ability to communicate effectively and efficiently is huge. Not all players want to hear about the x, z, or y movements, but all players want simple demonstrations of how to get better, this is one way we strive to do so. A ton of credit goes to our entire Student-Manager staff! -Pitching Coach Eric Niesen “Pitch Design” has become fully part of the modern baseball vocabulary, but the concept in and of itself stops short of prescribing an effective player development approach. It takes the right combination of goals, measurements, and cues to guide an athlete towards a desired outcome. In most cases, all of the analysis in the world is ineffectual if it is not communicable to the player and applicable to practice. All players, regardless of their knowledge or interest in the role of spin characteristics, should be put in a position to understand their arsenal and take control of their own development. This puts the onus on an analytics staff to decipher complex pitch components and present concise, goal-oriented training approaches to coaches and players. One of the most important metrics to understanding why pitches move the way they do is Spin Efficiency, or the percentage of a pitch’s total spin that is in the x (back spin) or z (side spin) direction. More simply put, this is the percentage of the spin on a pitch that will influence movement, because spin in the y direction (gyro or football spin) does not. While it says nothing of Axis of Rotation or Spin Direction, Spin Efficiency makes a good starting point for pitch design and lends itself to broadly applicable ranges for each pitch type. For example, a fastball with true backspin will be 100% efficient, maximizing the amount of vertical break for a pitcher’s given spin rate, giving the illusion of “lift” or “carry” on the fastball. As efficiency comes down, less of the pitch’s total spin is converted to movement, and the pitcher loses some of that deceptive effect. Rather than shift the responsibility of understanding the complex relationships between spin characteristics and movement onto the athlete, the approach we’ve begun to take at Georgetown is developing “target zones” for each pitch in a player’s arsenal that allows them to quickly digest whether progress is being made throughout a single bullpen, outing, or an entire season. Much of what will ultimately change Spin Efficiency, Direction, and Axis occurs just before release, and it may be unrealistic to expect many athletes to be able to focus intently on their hand and wrist position every pitch while still performing at a high level. The target zones allow both coaches and players the flexibility to find what cues work in a practice setting while still making those crucial micro-level improvements. Putting our target zones of Spin Rate and Spin Efficiency right next to a similar map of each pitch’s movement makes clear to players the interplay between a pitch’s “internal” spin characteristics and “external” movement pattern. 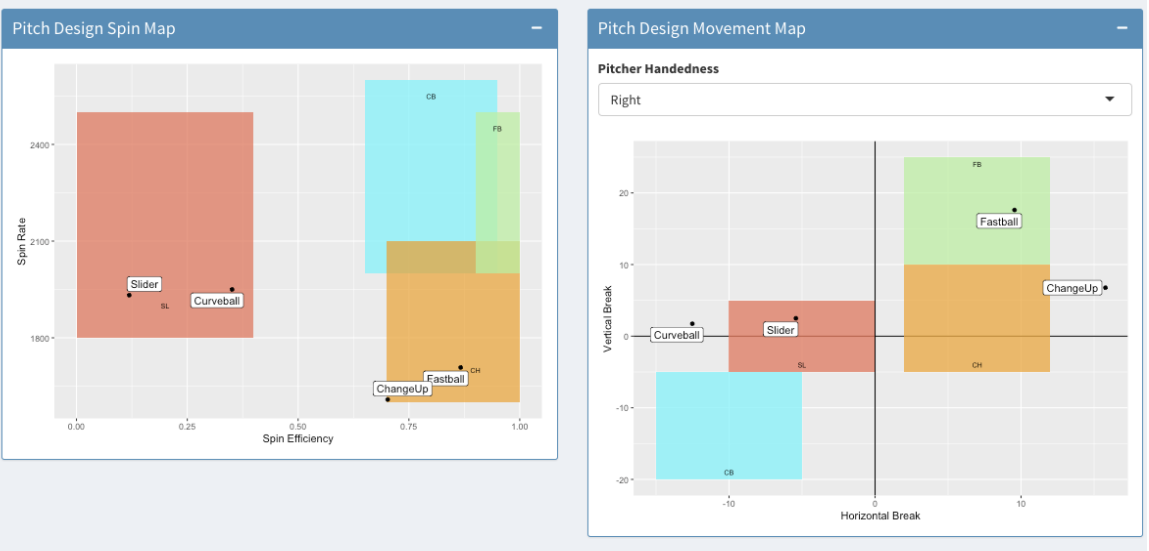 Calculating and analyzing those “internal” characteristics helps explain many of the results visible on the field, and confirm the conclusions a player or coach may draw from the “eye test.” It can also uncover important insights that help orient an individual development approach. Take the following pitcher as an example. The athlete is a high-level arm, and a consistent starter at the collegiate level. A closer look at his arsenal’s spin characteristics, however, reveals potential areas for improvement: 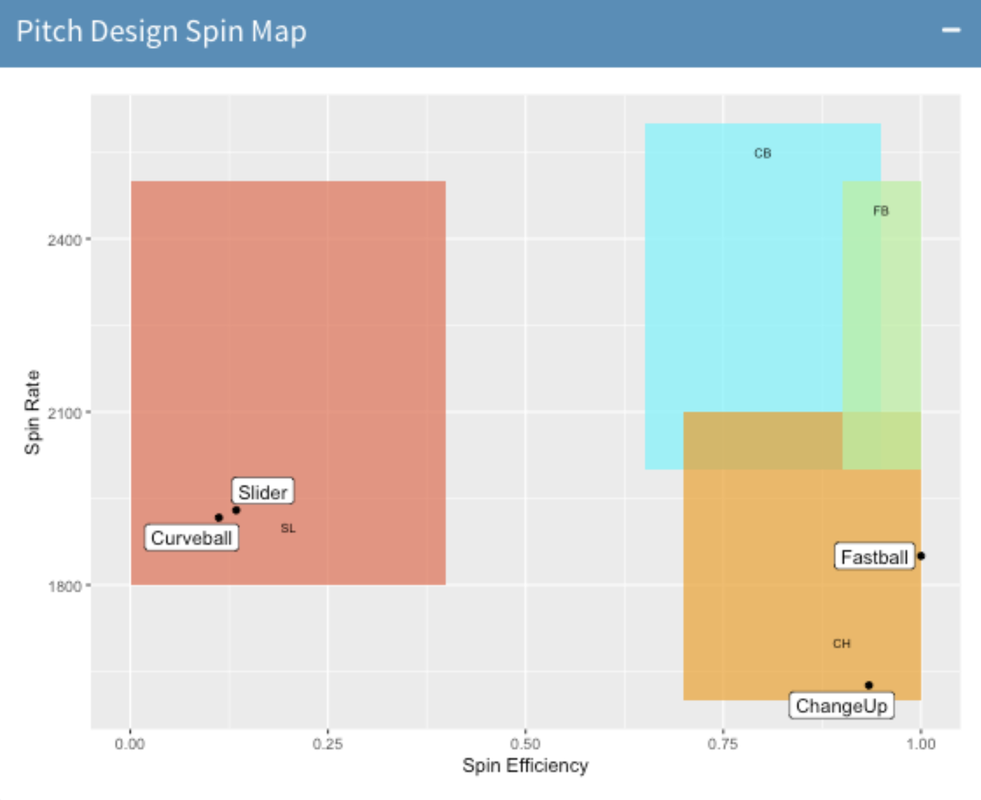 This pitcher’s Slider and Curveball are nearly identical in spin rate and efficiency, and their similarity is confirmed by a look at the corresponding movement map: 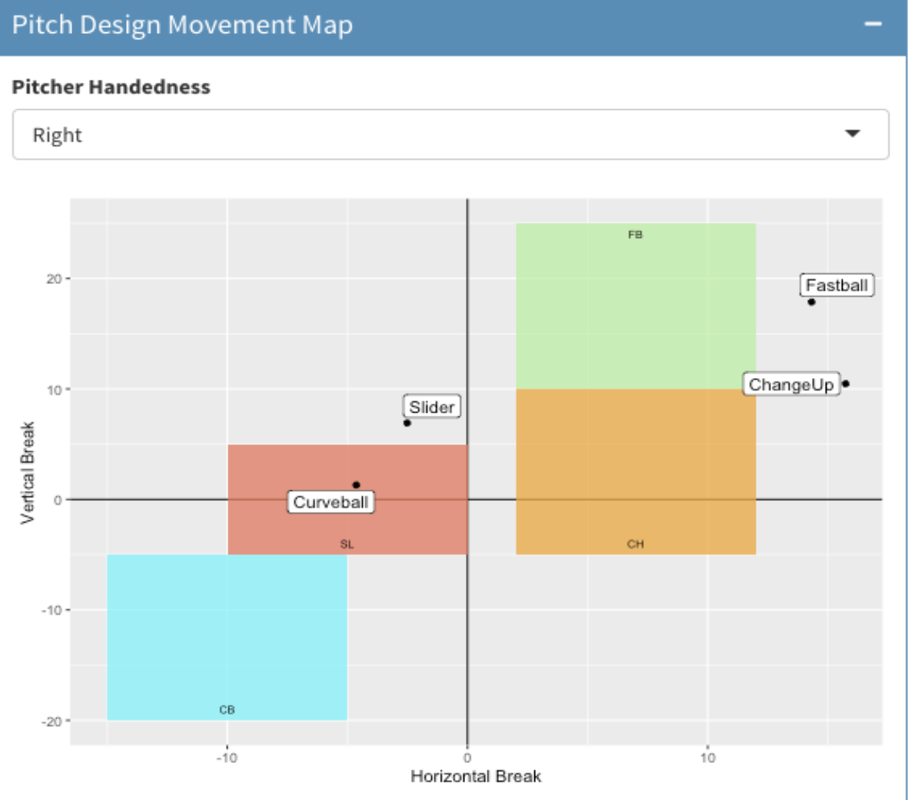 And when using a trajectory visualization tool, in this case Driveline EDGE: This has a few important implications. First, athletes have limited training time and effort available for pitch design, and spending equal training economy on two different pitches that have identical characteristics is an inefficient use of practice. This player would be better served improving one pitch at the expense of the other rather than continuing to throw both equally. Second, if a coaching staff is not familiar with their pitcher’s arsenals to this level of detail, they may use call pitches relying on a differentiable Slider and Curveball. In reality, these two breaking pitches are nearly indistinguishable to a hitter out of hand, with only slight variation in Spin Axis to separate them. This puts an uninformed staff at a disadvantage with a solid starter on the mound, and clearly demonstrates the necessity of going beyond the “eye test” in pitch design. For this pitcher, creeping up towards the low end of our “target box” with his curveball would dramatically alter the look and deceptiveness of his arsenal. Once breaching the 70% spin efficiency threshold we’ve laid out, his breaking pitches would take on significantly more life (Fastball included for reference): There’s no doubt that the dozens of pitch characteristics returned by systems like Rapsodo and Trackman can seem isolated and difficult to utilize on their own, but given the proper context and with appropriate comparison, we can make sense of their role -- and more importantly -- how they can be manipulated to make players better. This is true of analytics teams, coaching staffs, and players alike. Packaging complex analysis in digestible, goal-oriented visuals like our targets holds the greatest potential for development and ultimately on-field success.
0 Comments
|
AuthorWrite something about yourself. No need to be fancy, just an overview. Archives
August 2020
Categories |
 RSS Feed
