
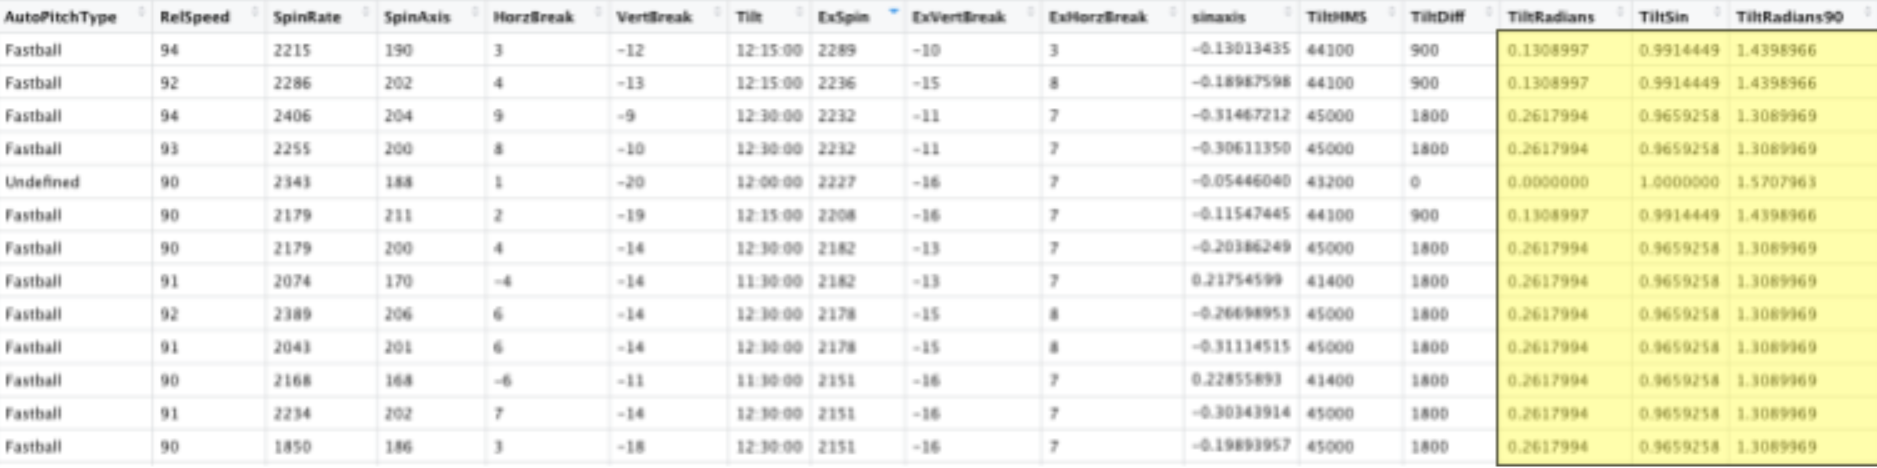
 By Noah Thurm In throwing a fastball, all spin is not created equal. Although it is well understood that higher spin fastballs induce more swings and misses, fly balls, and weak contact than a low-spin fastball of the same velocity, that simple analysis has two crucial shortcomings from a player development perspective. First, spin is as close to an inherent characteristic as there exists in pitchers, making it exceptionally difficult to train. As much as we might like to be able to skyrocket a pitcher’s spin rate, short of employing foreign substances there isn’t much to be done. It will improve with added velocity, but the ratio between a pitcher’s velocity and spin is all but fixed. Second, the benefits enjoyed by high-spin pitchers on their fastballs depend not just on how well a player spins the ball but on how much of their raw spin is converted to vertical movement. Spin resists the downward pull of gravity by generating lift via the Magnus Force, giving high-spin fastballs the illusion of “rising” as they reach the zone. However, only the spin that is around a horizontal axis, called transverse spin, contributes to backspin and lift. So, where does this leave us? While we may not be able to do much about a given pitcher’s spin rate, if we can understand how much movement he is getting, and more importantly, how much he should be getting we can develop a novel training and pitch design plan. The dilemma we are left with then is this: who gets the most out of their fastballs and who can improve. To help with this, we developed a new composite metric based on prior research by Driveline Baseball called “Pitch Potential Percentage.” Drawing on over 200 pitchers’ worth of data from the 2020 season, we built a model for predicting the spin rate and vertical movement of an average pitcher’s fastball given a velocity and release characteristics. To nail down a prediction for vertical movement, we find an expected transverse spin rate. By taking averages at each velocity and multiplying by the sin of the tilt in radians we can isolate the vertical component of the pitch vector and hone in on vertical break. Having an “expected” spin rate and vertical movement lets us compare our pitchers’ metrics to an average D1 pitch and see who has the potential for growth. Particularly, we were interested in players who are not getting the most from their spin, and therefore don’t have as effective a fastball as they could. That’s where Pitch Potential Percentage, the difference in percentile rank for a pitcher’s spin rate and vertical movement compared to the model’s prediction at their fastball velocity, comes in. The players with the highest Percentages are guys whose spin performs significantly better against the model than their movement, tipping us off that with some tweaks to wrist, hand, and finger position at release we can alter the pitch’s axis and movement profile. 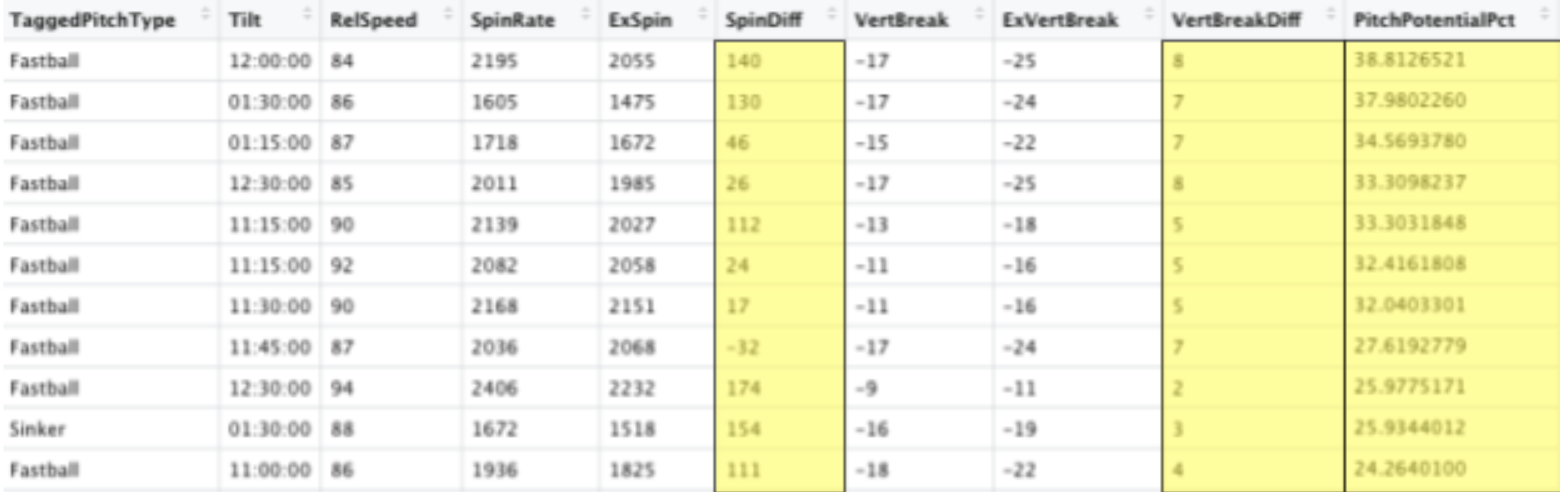 Pitch Potential Percentage isn’t a silver bullet though, as there are certain pitchers who may not want to maximize vertical movement. Sinkerballers, for instance, throw with very little transverse spin and might be hurt by adding an extra inch of lift to their fastball, and cutter-dominant pitchers may thrive by generating gyro spin and horizontal movement. 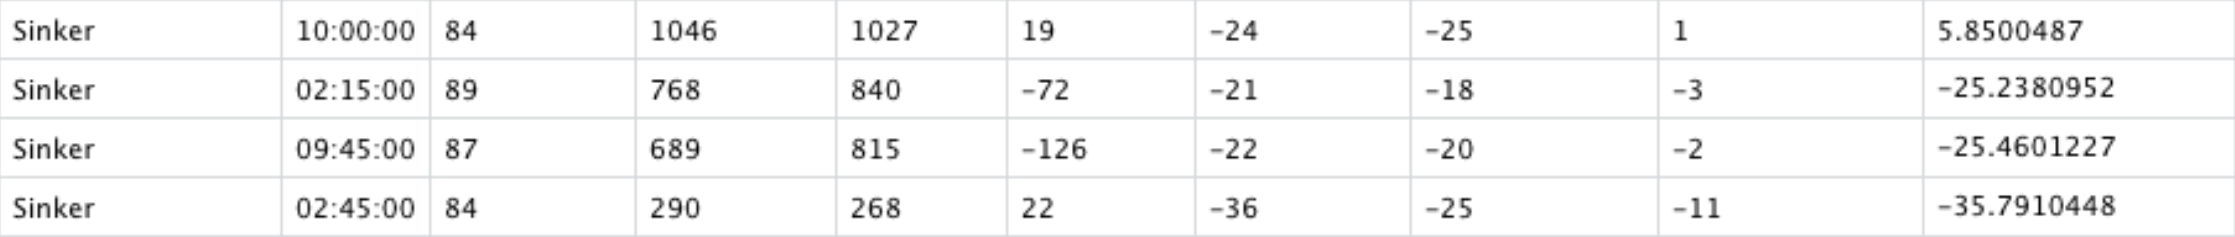 For the pitcher who is throwing a true four-seamer and is looking for an extra edge, Pitch Potential Percentage may tell us how we can squeeze out every bit of performance possible today. Moving forward, we’ll look to track progress towards a potential of 0, and see how similar methodologies can be applied to breaking and offspeed pitches.
0 Comments
Leave a Reply. |
AuthorWrite something about yourself. No need to be fancy, just an overview. Archives
August 2020
Categories |
 RSS Feed
