
By: Noah Thurm
It's September 14th, and I still can't get this Mike Trout at-bat against Kenley Jansen from a month ago out of my head:
Sure they were borderline, but how does the best player on the planet take 3 strikes without even so much as starting his swing? I'm not in the business of disagreeing with Trout on anything when it comes to hitting, but his startling passivity here got me thinking about the broader strategy at play, and what swing behavior on those borderline pitches might tell us. The ability to distinguish between pitches just in and just out of the zone surely is important to a hitter's success, and I wanted to better understand who does it well and the specific implications of this more specific plate discipline. I found that controlling the edges first lets a hitter dominate the middle and command an AB, which are incredibly powerful skills to have. First though, I needed to start sorting pitches by location. To come up with a classification system, I used Statcast's zones as a point of departure:
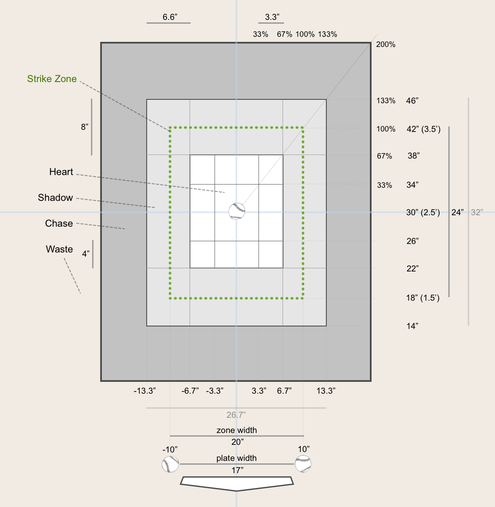
To answer my question, though, I had to split Statcast's "Shadow" into two different zones, "Edge", the portion in the strike zone, and "EdgeOff," the portion outside of the zone. In trying to find significance in swing behavior around the edges, I first thought that the difference between a player's "Edge" swing rate and "EdgeOff" swing rate, or "Edge Differential", as I called it, would show some meaningful relationships with production. It seemed logical: the guys with the biggest differentials are the most in tune with where exactly the strike zone starts and stops, and that ought to translate to their performance. This produced some really noisy data, however, and no strong trends emerged, so I went back to the raw swing rates, this time looking at walk rate. With some basic regression analysis, I found that "EdgeOff" swing rate outperformed chase rates, whiff rates, zone swing, and O-swing in predicting a player's walk rate, per a relative importance test:
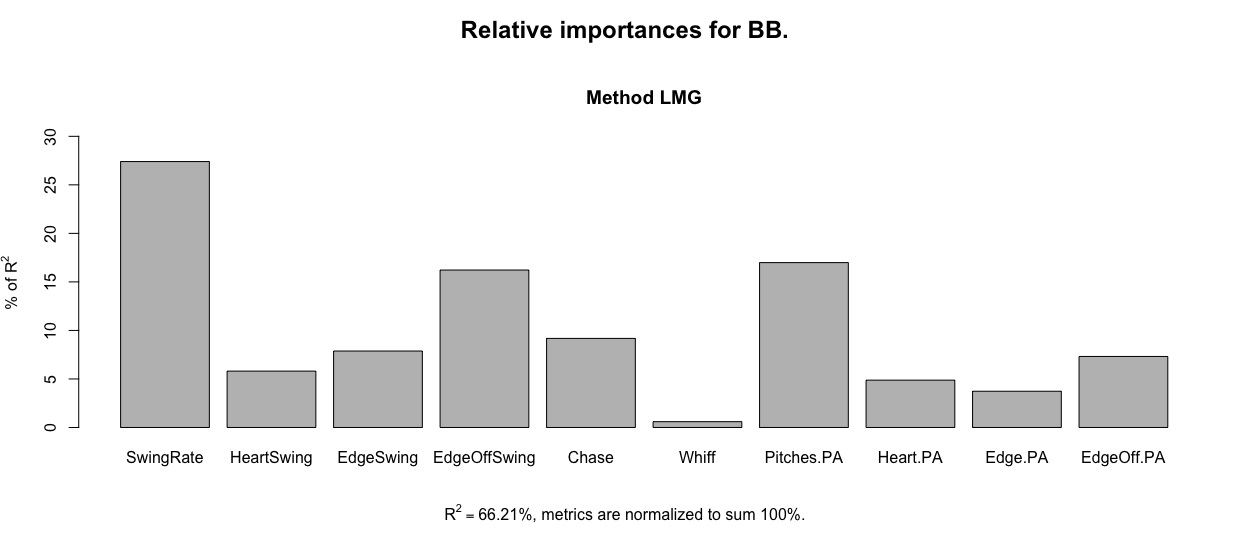
That was interesting, but hardly revolutionary. Players who swing at fewer balls walk more -- fascinating -- it just so happened that the type of ball I was looking at was seemingly most important. It wasn't until I started thinking about the intra-AB consequences of that patience that some more meaningful relationships began to emerge. Not only do players with better discipline walk more, they see more pitches per plate appearance (denoted by "Pitches.PA" in the model). And the longer an at-bat goes on, the more likely a pitcher is to make a mistake. Looking at the percentage of pitches in the heart of the plate by pitch of at bat shows us the benefits of battling:
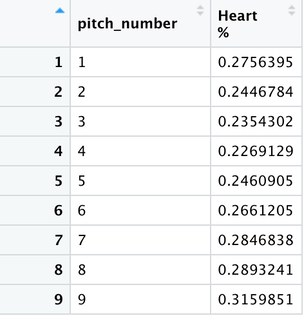
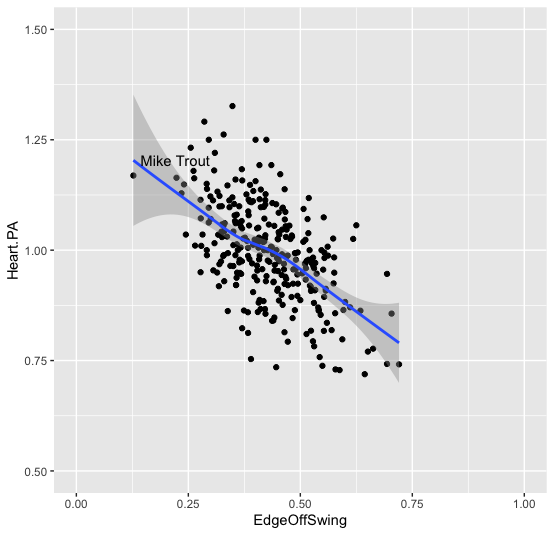
Pitchers try to get ahead early and attack the zone, but in longer at bats by the 5th pitch there is a consistent upward trend in pitches over the heart of the plate. What's surprising is that the correlation between "EdgeOff" swing rate and Heart pitches per PA is the exact opposite of the correlation between pitches per PA and Heart pitches per PA (r = -0.6 and r = 0.6). Showing this graphically begins to explain Trout's approach and why he may have spat on all three Jansen fastballs:
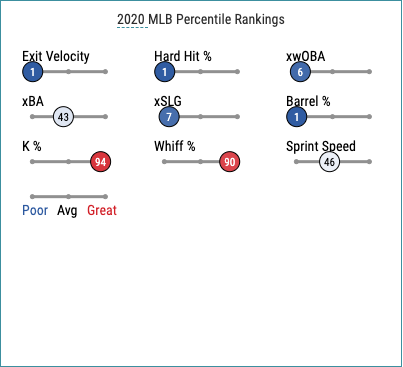
Why is the most dangerous hitter in the game seeing the third most meatballs of players with at least 100 PAs this year? Trout's vision and discipline are elite, and pitchers are forced to come over the plate to him because he just won't expand the zone. Once a pitcher does come in, though, Trout swings, and as we know, doesn't often miss. His swing density plot is a testament to this extreme discipline and self awareness:
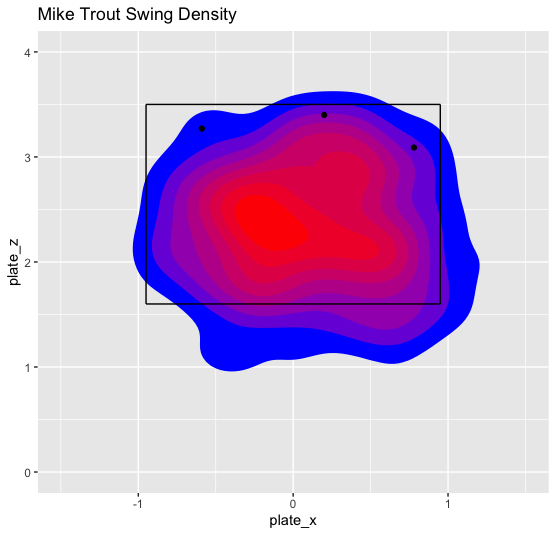
The one place he will expand the zone is down, which he historically crushes. The three pitches from Jansen were all up and classified as "Edge" pitches, dodging the hot zones of Trout's swing behavior. Rather than expand his zone and put suboptimal swings on three well-executed pitches, it seems like Trout was willing to take the strikes, banking on a mistake later on. This strategy didn't work in that at-bat and the Angels lost the game, but Trout's selectivity clearly pays dividends over the course of a season. By contrast, the player with the highest "EdgeOff" swing rate this year, Hanser Alberto, has put on a less-than-stellar showing for the Orioles.
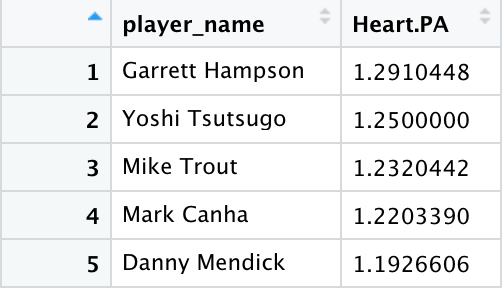
He also sees the fewest Heart pitches per plate appearance on average, and those marginal differences certainly matter as at-bats, games, and seasons wear on. Obviously, players hit Heart pitches better than others, but just how much so is a little striking:
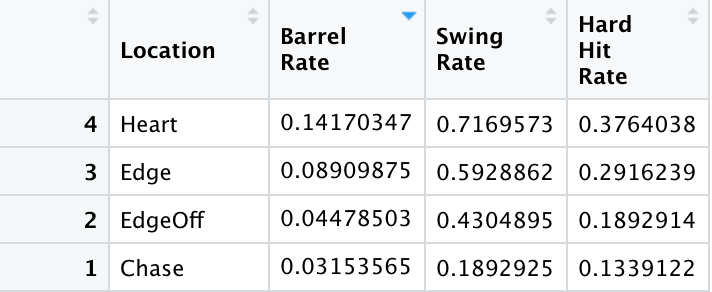
The Major League average for Barrels per Batted Ball Event (Barrel Rate) this year is 9.49%, meaning players are faring roughly 50% better on Heart pitches. Pitches on the Edge are still in the zone, but hitters barrel them up only 2/3 as often. Most importantly, "EdgeOff" pitches can be separated by Edge pitches by mere fractions of an inch, but players are producing just half as well on those pitches. Making the distinction between just in and just out can amount to a whole-meatball difference per game, and put players in a position where average looks like this:

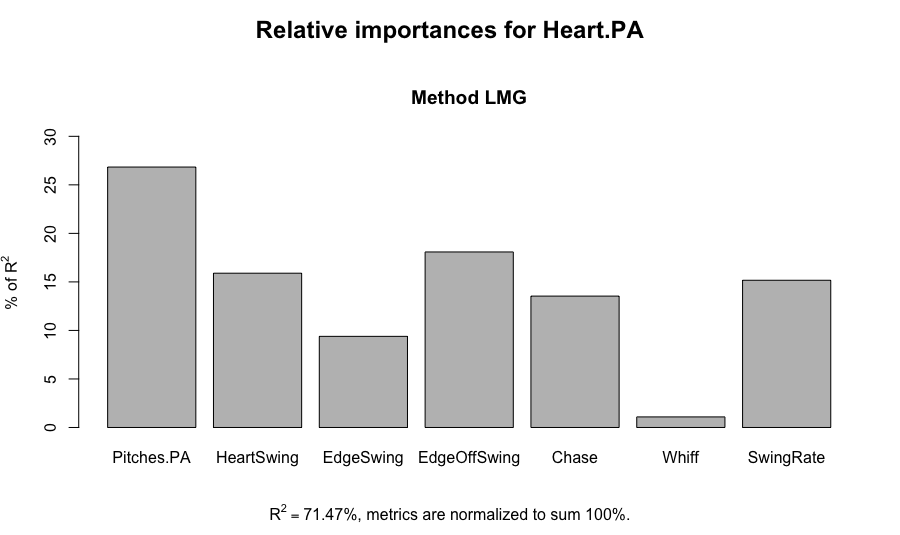
As far as seeing more pitches over the heart, having a low "EdgeOff" swing rate is more important than even Chase and Whiff rates. Eliminating a pitcher's ability to nibble around the zone is a hugely beneficial but difficult to develop skill, but its significance is undeniable in predicting pitches over the Heart per PA:
We know successful hitters control the zone and don't chase bad pitches, but there's clearly more to understanding discipline than just ball and strike. Edge pitches are still tough to hit, and if a pitcher knows he can still get a swing on a mis-executed Edge pitch that ends up out of the zone, he has no reason to tangle with the middle of the plate. Being able to consistently differentiate between those borderline pitches puts the hitter in the driver's seat and increases the chance of seeing a mistake. That's not to say that this analysis is without limitations, however. It may be that worse hitters are challenged more and just have fewer opportunities to overswing; Trout isn't exactly among league-leading thumpers in the Heart per PA rankings. In fact, we find no strong correlation between swing behavior around the edges and statistics like SLG or WOBA. What is convincing, though, is the need to look at discipline with a sharper eye than just O-Swing and Zone Swing to begin understanding the benefits of sitting on a particular spot vs. attacking all strikes. Other metrics like Strike Probability are emerging as ways to better quantify discipline, and I'm interested to see how the research develops, particularly around the edges of the zone. Hitters want mistakes to punish, and in the interest of seeing more they may be better off tipping the cap and taking a well-placed strike than trying to barrel a tough pitch. Not all pitches you can hit are pitches you should hit, and understanding that could lead to more swings to damage with, and ultimately more success.
0 Comments
Leave a Reply. |
AuthorWrite something about yourself. No need to be fancy, just an overview. Archives
August 2020
Categories |
 RSS Feed
